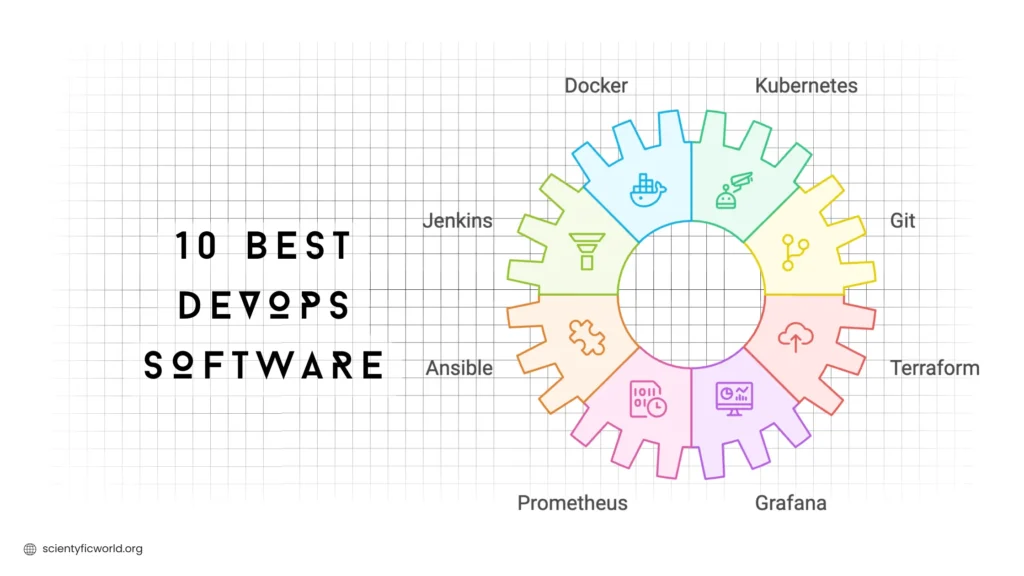
A DevOps toolchain is a handful of choices, not a shopping list: where code lives, how it gets built and tested, how it is packaged and deployed, how infrastructure is defined, where secrets live and how you know it is working. This guide goes through those jobs in order and names the tools that are most widely used for each, with what they cost or how they are licensed as of October 2026.
Two notes on method. First, I have not benchmarked these tools against each other, so there are no scores or star ratings here; an earlier version of this post had 4.x out of 5 ratings that had no real methodology behind them, and I removed them. Second, every price and license below comes from the vendor’s own page, and I link it so you can check the current figure, because pricing moves faster than blog posts.
The Short Answer
| Job | Common choices | Start here if you are small |
|---|---|---|
| Source control | Git (hosted on GitHub, GitLab or Bitbucket) | Git on GitHub or GitLab |
| CI/CD | GitHub Actions, GitLab CI/CD, Jenkins, CircleCI | The CI built into your Git host |
| Containers | Docker, Kubernetes | Docker first; Kubernetes only when you need it |
| GitOps delivery | Argo CD, Flux | Skip until you run Kubernetes |
| Infrastructure as code | Terraform, OpenTofu, Ansible | OpenTofu or Terraform for cloud, Ansible for servers |
| Secrets | HashiCorp Vault, OpenBao, your cloud’s secret manager | Your cloud’s secret manager |
| Observability | Prometheus, Grafana, OpenTelemetry, New Relic | Prometheus plus Grafana, or a managed free tier |
| Code quality | SonarQube | SonarQube Community Build |
How to Choose
- Prefer what you already pay for. If your code is on GitHub or GitLab, their built-in CI is usually the lowest-friction start.
- Check the license, not just the price. Several well-known tools changed from open source to source-available licenses in recent years. That matters if you redistribute them or build commercial services on top.
- Add tools when a problem appears. A three-person team rarely needs Kubernetes, a GitOps controller and a paid observability suite on day one.
- Count the people cost. Self-hosting something like Jenkins or Vault is free to download and costs engineer time to run and patch.
Source Control and CI/CD
Git. The distributed version control system almost everything else assumes. Branching, history and pull-request workflows all start here. You will use it through a host such as GitHub, GitLab or Bitbucket.
Watch out: Rewriting shared history (force-pushing after a rebase) can destroy teammates’ work; agree on rules for protected branches.
GitHub Actions. CI/CD defined as YAML workflows inside your repository. GitHub’s billing documentation says it is free for self-hosted runners and for public repositories on standard GitHub-hosted runners, and the Free plan includes 2,000 minutes a month for private repositories. The standard 2-core Linux runner is listed at $0.006 per minute beyond the allowance. I wrote a full example in a CI/CD pipeline with Docker.
Watch out: Pricing and included minutes change; read the billing page before you estimate costs.
GitLab CI/CD. CI/CD inside GitLab’s single platform for repositories, issues and pipelines. GitLab’s pricing page lists a Free tier (5 users per top-level group, 400 compute minutes a month) and Premium at $29 per user per month billed annually; Ultimate is quoted by sales.
Watch out: Free-tier limits are small for a growing team.
Jenkins. The long-standing open-source automation server, extended through a very large plugin ecosystem and pipeline-as-code. Pick it when you need to self-host, have unusual build requirements or must integrate with older systems.
Watch out: You run and patch it yourself, and plugin sprawl is the usual source of pain. If you are starting fresh and use GitHub or GitLab, the built-in CI is simpler.
CircleCI. A hosted CI/CD service with a usage-based credit model. Its pricing page lists a Free plan with 30,000 credits a month and the Performance plan starting at $15 a month.
Watch out: Credit-based pricing makes cost depend on machine size and usage, so estimate with your real build times.
Containers and Orchestration
Docker. Packages an application and its dependencies into an image that runs the same on a laptop, in CI and in production. Docker’s pricing page lists Personal at $0, Pro at $9 per user per month billed annually ($11 monthly), Team at $15 annually ($16 monthly) and Business at $24, with Docker Hub pull limits on the free plan. For practical setups see how to Dockerize a React app and how to avoid port conflicts in Docker.
Watch out: Docker Desktop plans are for individuals and organizations; read the terms if your company is large. Container images still need patching and scanning.
Kubernetes. The standard system for scheduling, scaling and healing containers across many machines. It is a graduated project of the Cloud Native Computing Foundation, per the CNCF project list, and every major cloud offers a managed version.
Watch out: It is a lot of machinery. If you run a handful of containers, a single server with Docker Compose, or a managed container service, is often enough.
GitOps Delivery
Argo CD. A declarative GitOps tool for Kubernetes: the desired state lives in Git, and Argo CD keeps the cluster in sync with it. Argo is a CNCF graduated project and works with Helm and Kustomize.
Watch out: Only useful if you run Kubernetes, and it adds a controller you must operate.
Flux. The other CNCF graduated GitOps tool for Kubernetes. Teams choose between Flux and Argo CD mostly on workflow preference: Argo CD is known for its web interface, Flux for its set of composable controllers.
Infrastructure as Code and Configuration
Terraform. Describes cloud infrastructure in declarative configuration and works across many providers. In August 2023 HashiCorp moved its products from the Mozilla Public License to the Business Source License, which allows use and modification but restricts offering a competing product. For most teams using Terraform internally that makes little practical difference, but it is no longer “open source” in the strict sense, which the earlier version of this post claimed.
Watch out: State files need careful handling, and the license matters if you build commercial products on top.
OpenTofu. A community-driven fork created in response to the license change, hosted under the Linux Foundation and presented as a drop-in replacement for Terraform. Choose it if you want an open-governance option that works with existing Terraform configurations.
Watch out: The two projects now add features independently, so check compatibility for the specific features you rely on.
Ansible. Agentless configuration management and automation written in YAML playbooks. It connects over SSH, so there is nothing to install on target machines, which makes it a good fit for configuring servers and repeatable tasks.
Watch out: Playbooks can become slow and tangled across very large fleets; keep roles small and tested.
Secrets Management
HashiCorp Vault. Stores and controls access to secrets, supports short-lived dynamic credentials and encryption as a service. It is covered by the same Business Source License change as Terraform.
Watch out: Running Vault well takes real operational effort (unsealing, high availability, upgrades). If you are on one cloud, its native secret manager may be enough.
OpenBao. A community fork of Vault governed under the Linux Foundation’s OpenSSF. Consider it if you want a Vault-style secrets manager with open governance.
Watch out: It is a younger project than Vault; check that the features and integrations you need exist.
Monitoring and Observability
Prometheus. An open-source monitoring system that collects time-series metrics and alerts on them using PromQL. It is a CNCF graduated project and the usual metrics backend for Kubernetes. A full working example is in monitoring Docker containers with Prometheus and Grafana.
Watch out: Prometheus is not built for long-term storage on its own; teams add a remote storage system for that.
Grafana. Dashboards and alerting over many data sources, most often paired with Prometheus. Grafana Labs announced in April 2021 that its core open-source projects were moving from Apache 2.0 to AGPLv3.
Watch out: Dashboards drift if nobody owns them; keep them in version control.
OpenTelemetry. A vendor-neutral standard and set of SDKs for producing traces, metrics and logs. It is a CNCF graduated project, and instrumenting with it keeps you from being locked to one observability vendor.
Watch out: It is an instrumentation layer, not a backend; you still need somewhere to send the data.
New Relic. A managed observability platform covering application performance, infrastructure and tracing. Its pricing page lists a free tier with 100 GB of data ingest a month and one free full-platform user, with usage-based pricing beyond that (data at $0.40 per GB beyond the free allowance on the standard option, plus per-user charges).
Watch out: Usage-based bills can grow quickly with data volume; set budgets and sampling.
Code Quality and Security Scanning
SonarQube. Continuous inspection of code for bugs, vulnerabilities and maintainability problems, wired into CI. Sonar’s download page lists Community Build as the free, open-source edition and paid Developer, Enterprise and Data Center editions above it.
Watch out: The free edition has fewer languages and features than the paid ones; check that your languages are covered.
Where AI Fits In
Many of these vendors now ship AI-assisted features, such as pipeline suggestions or alert summaries. They are worth trying, but treat them like any other automation: review what they change, keep humans on production approvals, and do not feed secrets or private code to a service whose data policy you have not read.
A Sensible Starter Stack
- Git on GitHub or GitLab, with protected main branches.
- The CI that comes with it, running tests and building a Docker image on every pull request.
- A managed container or server host before Kubernetes; add Kubernetes when you have a reason.
- OpenTofu or Terraform for cloud resources, kept in Git.
- Your cloud provider’s secret manager for secrets.
- Prometheus and Grafana, or a managed free tier, with alerts on a few user-visible symptoms.
Conclusion
The best DevOps tool is the one your team can run reliably. Start with Git and the CI built into your host, containerize with Docker, and add orchestration, GitOps and heavier observability only when a concrete problem justifies them. Check licenses as well as prices, since several popular tools have changed terms, and re-check the vendor pages linked above before you commit budget.
FAQs
What are the most important DevOps tools?
A version control system (Git), a CI/CD service, a container runtime (Docker), infrastructure as code (Terraform or OpenTofu) and a monitoring stack (Prometheus and Grafana or a managed alternative) cover the core of most teams’ needs.
Is Terraform still open source?
Not in the strict sense. HashiCorp moved its products to the Business Source License in August 2023. The code is available and can be used internally, but the license restricts offering competing products. OpenTofu is a Linux Foundation fork for teams that want open governance.
Do I need Kubernetes to do DevOps?
No. DevOps is about automation, fast feedback and shared ownership. Many teams run well on Docker Compose or a managed container service and adopt Kubernetes later, if at all.
Which CI/CD tool should a small team pick?
Usually the one built into the platform that hosts your code: GitHub Actions for GitHub or GitLab CI/CD for GitLab. Jenkins makes sense when you need to self-host or integrate with unusual systems.
Is Docker free?
Docker Personal is free for individuals; Pro, Team and Business plans are paid per user. Docker’s current pricing page lists the plans and Docker Hub pull limits.
What is the difference between Prometheus and Grafana?
Prometheus collects and stores metrics and evaluates alert rules. Grafana visualizes data from Prometheus and many other sources. They are usually used together.