If you’ve poured weeks into documentation and still hear “the docs are bad” without any concrete signal of what that means, you’re not alone. This guide shows you how to turn that vague pain into hard numbers you can act on. We’ll define the core documentation metrics (time-to-first-success, ticket deflection, engagement, ROI), wire them into real data sources (GA4, Zendesk, warehouse tables), give you ready-to-run SQL, and walk through the dashboard and ROI math step by step. By the end, you’ll be able to say, with a straight face and a real chart, “this doc change saved us 1,200 tickets and paid for itself three times over.”
Why should you measure documentation at all?
Documentation feels “soft” until support queues explode, sales complains about confusion, or developers stall because they can’t find the right endpoint example. Measuring documentation isn’t about vanity graphs; it’s about linking your work to three very concrete business outcomes:
- Lower support cost: Fewer tickets per active user because people solve problems themselves.
- Faster customer and developer success: Shorter time from “I’m stuck” to “it works,” which shows up as higher retention and conversion.
- Happier teams and cleaner product feedback: When docs handle the basics, support and product teams can focus on real edge cases and roadmap decisions.
Once you put numbers on these, priorities change. Documentation moves from “nice to have” to “operational lever.” That’s the real point of tracking documentation metrics.
Which documentation metrics actually matter?
You can measure dozens of things, but a smaller, opinionated set works better. Here’s a prioritized list of documentation metrics and KPIs that I’ve seen consistently drive useful decisions.
1. Time-to-first-success (TTFS)
What it is: Median time between a user’s first documentation page view and their first “it worked” signal.
Why it matters: It approximates how quickly your docs help someone complete a task. If TTFS drops, your docs usually got clearer, more discoverable, or better aligned with user intent.
Core formula (per user):
TTFS_user = timestamp(task_success) - timestamp(first_docs_page_view)
You’ll usually track the median TTFS across a cohort over a 28-day rolling window.
2. Ticket deflection rate
What it is: The share of potential support interactions that docs absorb before they become tickets.
Why it matters: This is where your CFO starts paying attention. Deflection translates directly into support cost savings and faster response times for the tickets that remain.
Two useful variants:
- Deflection by ticket link: How many tickets explicitly reference knowledge base or docs content.
- Deflection by view: How often a help-center visit does not turn into a ticket within a set window.
3. Engagement with documentation
What it is: A cluster of behavioral signals that show whether people are actually using and interacting with your docs, not just bouncing.
Why it matters: Engagement doesn’t equal success, but dead pages rarely help anyone. When engagement drops, something is wrong with discoverability, relevance, or clarity.
I like to track:
- Average time on page for docs URLs.
- Median scroll depth from scroll events.
- Click-to-expand rate for collapsible sections (FAQs, accordions).
4. Documentation ROI (doc ROI)
What it is: A financial view of how much value your documentation generates relative to what it costs to build and maintain.
Why it matters: Docs teams rarely get budget increases without a solid ROI story. Once you quantify how many tickets and hours you’re saving, you can argue for headcount and tooling like any other product investment.
We’ll define an explicit formula and walk through a numeric example in a dedicated section below.
5. Search effectiveness (optional but powerful)
What it is: How often users find what they need via documentation search, and how often they hit a wall.
Signals: queries with “no results,” refinements, and search → page → success sequences.
Once you’re tracking TTFS and deflection well, search metrics are usually the next high-leverage layer.
How do you define these metrics precisely?
Vague metrics turn into arguments. Precise definitions reduce fights and make SQL reviews boring in a good way. Let’s pin down the main documentation KPIs with definitions and formulas you can put straight into your analytics spec.
Key GA4-style event and field names
Throughout this guide, I’ll assume these analytics events and fields (you can adapt the names, but keep them consistent):
page_viewwith parameterpage_locationcontaining'/docs/'for documentation URLs.task_success(or synonymdoc_task_complete) fired when a user finishes a key task that the docs are meant to unblock.scrollevents with parameterpercent_scrolled.click_expandevents for expanding accordions, code tabs, etc., with parametercomponent_type = 'accordion'.searchevents with parameterssearch_termandresult_count.search_no_resultsas either a separate event or asearchevent whereresult_count = 0.
For support tickets (for example from Zendesk):
- Ticket table field
via.channel(e.g.,'web','email','api'). - Custom field
help_center_article_idstoring the article ID if the ticket was created from a specific article. - Ticket creation timestamp field
created_at. - Optional:
requester_idto link to analytics user IDs if you run identity stitching.
Data & Implementation: where the numbers come from
You can’t calculate documentation KPIs from thin air. You need a small but reliable data pipeline. Think of it as instrumentation for your writing.
What does the data flow look like?
Diagram 1: Data flow (docs usage → analytics → BI)
[User reads docs]
    ↓ (page_view, scroll, task_success events)
[Analytics SDK: GA4 / Segment / Amplitude]
    ↓ (streamed events)
[Raw events table in warehouse (e.g., BigQuery)]
    ↓ (scheduled SQL transforms)
[Curated BI dataset: documentation_metrics_* tables]
    ↓
[Dashboards: Looker / Tableau / Metabase / Data Studio]
You don’t need a massive setup. You do need:
- A consistent way to mark documentation URLs (
/docs/prefix, subdomain, or content group). - At least one task-level success event (
task_successordoc_task_complete). - An export of support tickets and help-center views.
Ready-to-run SQL: time-to-first-success (TTFS) in BigQuery (GA4 schema)
This query calculates median TTFS per user and then aggregates across users over a 28-day window, using the GA4 export schema in BigQuery (analytics_XXXXX.events_*).
-- Median Time-to-First-Success (TTFS) in seconds over last 28 days
-- Assumes:
--   * GA4 export in BigQuery
--   * docs pages identified by page_location LIKE '%/docs/%'
--   * success event: 'task_success'

WITH docs_pageviews AS (
  SELECT
    user_pseudo_id,
    MIN(event_timestamp) AS first_docs_ts
  FROM
    `my_project.my_dataset.events_*`
  WHERE
    event_name = 'page_view'
    AND EXISTS (
      SELECT 1
      FROM UNNEST(event_params) AS p
      WHERE p.key = 'page_location'
        AND p.value.string_value LIKE '%/docs/%'
    )
    -- measurement window: last 28 days
    AND _TABLE_SUFFIX BETWEEN FORMAT_DATE('%Y%m%d', DATE_SUB(CURRENT_DATE(), INTERVAL 28 DAY))
                         AND FORMAT_DATE('%Y%m%d', CURRENT_DATE())
  GROUP BY user_pseudo_id
),

task_success_events AS (
  SELECT
    user_pseudo_id,
    MIN(event_timestamp) AS first_success_ts
  FROM
    `my_project.my_dataset.events_*`
  WHERE
    event_name = 'task_success'
    AND _TABLE_SUFFIX BETWEEN FORMAT_DATE('%Y%m%d', DATE_SUB(CURRENT_DATE(), INTERVAL 28 DAY))
                         AND FORMAT_DATE('%Y%m%d', CURRENT_DATE())
  GROUP BY user_pseudo_id
),

ttfs_per_user AS (
  SELECT
    d.user_pseudo_id,
    -- convert microseconds to seconds
    SAFE_DIVIDE(s.first_success_ts - d.first_docs_ts, 1e6) AS ttfs_seconds
  FROM docs_pageviews d
  LEFT JOIN task_success_events s
    ON d.user_pseudo_id = s.user_pseudo_id
  WHERE
    s.first_success_ts IS NOT NULL
    AND s.first_success_ts >= d.first_docs_ts
)

SELECT
  APPROX_QUANTILES(ttfs_seconds, 100)[OFFSET(50)] AS median_ttfs_seconds,
  COUNT(*) AS users_with_success
FROM ttfs_per_user;
Adapting this to other schemas:
- Segment + warehouse: Replace
event_namewithevent, andevent_timestampwithreceived_atortimestamp. Docs URL filter becomes something likeproperties.path LIKE '%/docs/%'. - Amplitude / Mixpanel exports: Same idea, but you’ll typically have a dedicated
user_idand a flatpage_urlproperty instead ofevent_params.
Ready-to-run SQL: monthly ticket deflection (two variants)
You can look at deflection from support’s point of view and from the user’s point of view.
Variant A: deflection_by_ticket_link
Definition:
ticket_deflection_by_ticket_link = 1 - (tickets_with_kb_reference / total_tickets)
Where tickets_with_kb_reference is the count of tickets that include a knowledge base article reference via help_center_article_id or a link field.
-- Monthly ticket deflection by ticket link (Zendesk-style export)

WITH tickets AS (
  SELECT
    DATE_TRUNC(DATE(created_at), MONTH) AS month,
    COUNT(*) AS total_tickets,
    COUNTIF(help_center_article_id IS NOT NULL) AS tickets_with_kb_reference
  FROM
    `my_project.support.zendesk_tickets`
  WHERE
    created_at >= DATE_SUB(CURRENT_DATE(), INTERVAL 6 MONTH)
  GROUP BY month
)

SELECT
  month,
  total_tickets,
  tickets_with_kb_reference,
  1 - SAFE_DIVIDE(tickets_with_kb_reference, total_tickets) AS deflection_by_ticket_link
FROM tickets
ORDER BY month;
This variant tells you: “of tickets that made it through, how many clearly used docs on the way?” It’s conservative, because a lot of people read docs and still don’t link them when opening a ticket.
Variant B: deflection_by_view
Definition:
ticket_deflection_by_view = views_without_ticket_after_view / total_views
You need:
- A table of help-center or docs views (from analytics export).
- A table of tickets, with either a user identifier or at least an anonymous session identifier that you can tie back to analytics, plus a timestamp.
-- Monthly ticket deflection by view: did a docs view avoid a ticket
-- Here we model a simplified join on a shared user_id between analytics and Zendesk.
-- In reality, you might use email, hashed email, or a mapping table.

WITH docs_views AS (
  SELECT
    user_id,
    event_timestamp,
    DATETIME(TIMESTAMP_MICROS(event_timestamp), "UTC") AS view_time,
    DATE(TIMESTAMP_MICROS(event_timestamp)) AS view_date
  FROM
    `my_project.my_dataset.events_*`
  WHERE
    event_name = 'page_view'
    AND EXISTS (
      SELECT 1
      FROM UNNEST(event_params) AS p
      WHERE p.key = 'page_location'
        AND p.value.string_value LIKE '%/docs/%'
    )
    AND _TABLE_SUFFIX BETWEEN FORMAT_DATE('%Y%m%d', DATE_SUB(CURRENT_DATE(), INTERVAL 180 DAY))
                         AND FORMAT_DATE('%Y%m%d', CURRENT_DATE())
),

tickets AS (
  SELECT
    requester_id AS user_id,
    created_at
  FROM
    `my_project.support.zendesk_tickets`
  WHERE
    created_at >= DATE_SUB(CURRENT_DATE(), INTERVAL 180 DAY)
),

views_with_ticket_flag AS (
  SELECT
    d.view_date,
    COUNT(*) AS total_views,
    COUNTIF(
      EXISTS (
        SELECT 1
        FROM tickets t
        WHERE t.user_id = d.user_id
          AND t.created_at >= DATETIME(d.view_time)
          AND t.created_at < DATETIME_ADD(DATETIME(d.view_time), INTERVAL 24 HOUR)
      )
    ) AS views_followed_by_ticket
  FROM docs_views d
  GROUP BY d.view_date
),

aggregated AS (
  SELECT
    DATE_TRUNC(view_date, MONTH) AS month,
    SUM(total_views) AS total_views,
    SUM(views_followed_by_ticket) AS views_followed_by_ticket
  FROM views_with_ticket_flag
  GROUP BY month
)

SELECT
  month,
  total_views,
  views_followed_by_ticket,
  SAFE_DIVIDE(total_views - views_followed_by_ticket, total_views) AS deflection_by_view
FROM aggregated
ORDER BY month;
Adapting to other schemas: The key piece is the “ticket within 24 hours after a docs view” window. If you only have session IDs, use those instead of user_id and shorten the window.
Engagement metrics: time_on_page, scroll depth, click-to-expand
Engagement is more fragmented, but easy to compute once you have the events.
Average time_on_page
If you’re using GA4, you can lean on engagement_time_msec per page_view event. If not, you can compute simple time deltas between page views within a session.
-- Average engagement time (seconds) per docs page over 28 days (GA4)

WITH docs_pageviews AS (
  SELECT
    (SELECT value.string_value FROM UNNEST(event_params)
      WHERE key = 'page_location') AS page_location,
    user_pseudo_id,
    event_timestamp,
    (SELECT value.int_value FROM UNNEST(event_params)
      WHERE key = 'engagement_time_msec') AS engagement_time_msec
  FROM
    `my_project.my_dataset.events_*`
  WHERE
    event_name = 'page_view'
    AND _TABLE_SUFFIX BETWEEN FORMAT_DATE('%Y%m%d', DATE_SUB(CURRENT_DATE(), INTERVAL 28 DAY))
                         AND FORMAT_DATE('%Y%m%d', CURRENT_DATE())
)

SELECT
  page_location,
  AVG(SAFE_DIVIDE(engagement_time_msec, 1000.0)) AS avg_time_on_page_seconds,
  COUNT(*) AS views
FROM docs_pageviews
WHERE page_location LIKE '%/docs/%'
GROUP BY page_location
ORDER BY views DESC
LIMIT 100;
Median scroll depth
-- Median scroll depth for docs pages (GA4 scroll events)

WITH scroll_events AS (
  SELECT
    user_pseudo_id,
    (SELECT value.string_value FROM UNNEST(event_params)
      WHERE key = 'page_location') AS page_location,
    (SELECT value.int_value FROM UNNEST(event_params)
      WHERE key = 'percent_scrolled') AS percent_scrolled
  FROM
    `my_project.my_dataset.events_*`
  WHERE
    event_name = 'scroll'
    AND _TABLE_SUFFIX BETWEEN FORMAT_DATE('%Y%m%d', DATE_SUB(CURRENT_DATE(), INTERVAL 28 DAY))
                         AND FORMAT_DATE('%Y%m%d', CURRENT_DATE())
)

SELECT
  page_location,
  APPROX_QUANTILES(percent_scrolled, 100)[OFFSET(50)] AS median_scroll_percent,
  COUNT(*) AS scroll_events
FROM scroll_events
WHERE page_location LIKE '%/docs/%'
GROUP BY page_location
ORDER BY scroll_events DESC
LIMIT 100;
Click-to-expand rate
-- Click-to-expand rate for docs accordions

WITH accordion_clicks AS (
  SELECT
    (SELECT value.string_value FROM UNNEST(event_params)
      WHERE key = 'page_location') AS page_location,
    COUNT(*) AS clicks
  FROM
    `my_project.my_dataset.events_*`
  WHERE
    event_name = 'click_expand'
    AND EXISTS (
      SELECT 1
      FROM UNNEST(event_params) AS p
      WHERE p.key = 'component_type'
        AND p.value.string_value = 'accordion'
    )
    AND _TABLE_SUFFIX BETWEEN FORMAT_DATE('%Y%m%d', DATE_SUB(CURRENT_DATE(), INTERVAL 28 DAY))
                         AND FORMAT_DATE('%Y%m%d', CURRENT_DATE())
  GROUP BY page_location
),

accordion_impressions AS (
  -- If you fire an event when accordions are rendered, use that here.
  -- Otherwise approximate with page_view counts for pages that have accordions.
  SELECT
    (SELECT value.string_value FROM UNNEST(event_params)
      WHERE key = 'page_location') AS page_location,
    COUNT(*) AS impressions
  FROM
    `my_project.my_dataset.events_*`
  WHERE
    event_name = 'page_view'
    AND _TABLE_SUFFIX BETWEEN FORMAT_DATE('%Y%m%d', DATE_SUB(CURRENT_DATE(), INTERVAL 28 DAY))
                         AND FORMAT_DATE('%Y%m%d', CURRENT_DATE())
  GROUP BY page_location
)

SELECT
  i.page_location,
  i.impressions,
  IFNULL(c.clicks, 0) AS clicks,
  SAFE_DIVIDE(IFNULL(c.clicks, 0), i.impressions) AS click_to_expand_rate
FROM accordion_impressions i
LEFT JOIN accordion_clicks c
  ON i.page_location = c.page_location
WHERE i.page_location LIKE '%/docs/%'
ORDER BY i.impressions DESC
LIMIT 100;
Dashboard & Reporting: what should you actually look at?
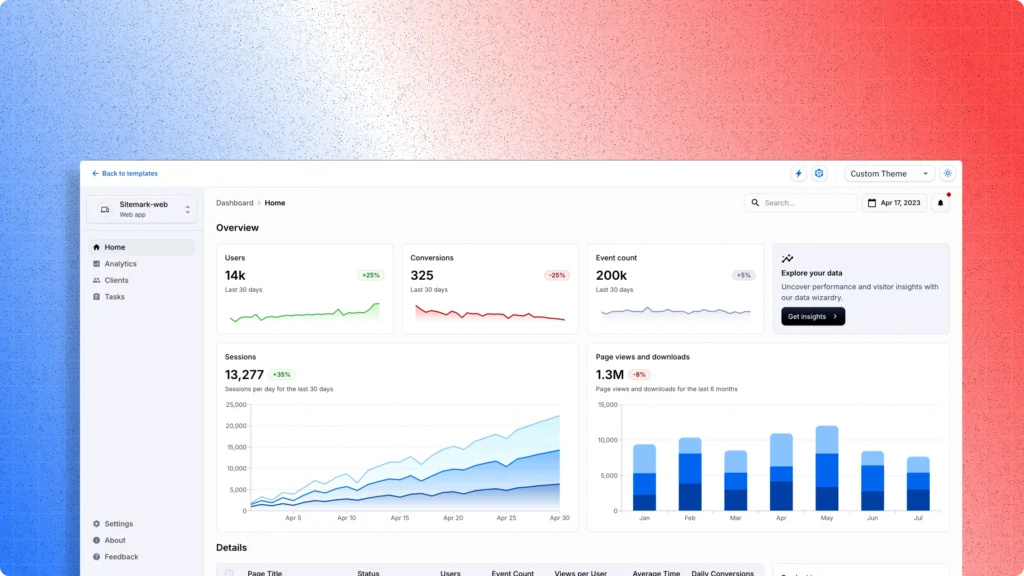
Once you have queries, the temptation is to build ten dashboards. Don’t. One focused documentation metrics dashboard is enough to drive decisions, as long as it’s designed around the right questions.
Dashboard mockup (layout and visuals)
Diagram 2: Documentation KPI dashboard wireframe (textual)
[ Top row: KPI tiles ]
  [TTFS (median, 28d)] [Ticket Deflection (28d)] [Engagement Score] [Doc ROI (last 90d)]

[ Middle row: charts ]
  [Left: TTFS trend line (last 6 months)]
  [Right: Ticket deflection trend (by view and by link)]

  [Below: Cohort chart - TTFS by first-seen month or by doc version]

[ Bottom row: detail tables ]
  [Left: Top articles by deflection & engagement]
  [Right: Search queries with no results & associated tickets]

[ Filters (global) ]
  Product | Version | Locale | Audience (dev/admin/end-user)
Suggested visual types
- KPI tiles: big numbers with small trend arrows and comparison vs previous period (28 days or 90 days).
- Line charts: TTFS and deflection over time. Add release markers when you ship major documentation changes.
- Cohort heatmap: rows as cohorts (by signup month or first docs visit), columns as weeks since first visit, color as median TTFS.
- Tables: sortable by deflection rate, TTFS, and engagement.
Refresh cadence
- Raw events: near-real-time or hourly (from GA4 / Segment).
- Curated documentation metrics tables: daily refresh is usually enough.
- Executive snapshot (for leadership decks): weekly export of KPIs with a short narrative: “we cut TTFS by 12% after rewriting the onboarding guide.”
Filters to implement
At a minimum:
- Product: map docs pages or article IDs to products or modules.
- Version: based on URL pattern (
/v1/,/v2/) or a content metadata field. - Locale: based on URL (
/en/,/de/) or locale field in your CMS.
When you can slice TTFS and deflection by version and locale, translation and versioning decisions become much less emotional and much more targeted.
How do you calculate documentation ROI?
Here’s the part that turns heads in budget reviews: the actual ROI math.
Explicit doc ROI formula
We’ll define:
ROI_value = (deflected_tickets * avg_cost_per_ticket)
          + (time_saved_per_user_hours * hourly_value * affected_users)
          - documentation_operational_costs

ROI% = ROI_value / documentation_operational_costs
Where:
- deflected_tickets comes from your deflection_by_view or deflection_by_ticket_link metrics, scaled by total tickets.
- avg_cost_per_ticket usually includes support agent time and tooling (commonly in the $5–$25 range depending on your business).
- time_saved_per_user_hours is your estimate of how much faster users succeed because of docs (for example, 0.25 hours = 15 minutes).
- hourly_value is either an internal productivity rate or estimated customer value per hour.
- affected_users is the number of unique users who used the docs for that feature or period.
- documentation_operational_costs includes writer time, engineering time for integration, tooling, and review.
Worked numeric example
Imagine this scenario over a quarter:
- Total tickets last quarter: 10,000.
- Ticket deflection_by_view suggests 25% of potential tickets are deflected.
- So
deflected_tickets = 10,000 * 0.25 = 2,500. avg_cost_per_ticket = $12(support team estimate).- Average time saved per user thanks to clearer onboarding docs: 0.3 hours (18 minutes).
- Hourly value per user: $50 (internal estimate of developer time).
- Affected users who visited onboarding docs this quarter: 5,000.
- Documentation operational costs for these docs (writers, editors, engineers, tooling share): $60,000.
Now plug in:
ROI_value =
  (deflected_tickets * avg_cost_per_ticket)
  + (time_saved_per_user_hours * hourly_value * affected_users)
  - documentation_operational_costs

= (2,500 * $12)
  + (0.3 * $50 * 5,000)
  - $60,000

= $30,000
  + ($15 * 5,000)
  - $60,000

= $30,000
  + $75,000
  - $60,000

= $45,000 net value

ROI% = $45,000 / $60,000 = 0.75 = 75%
Suddenly your “just documentation” work is a 75% ROI project. That’s a very different conversation than “we’d like a nicer theme and more time for diagrams.”
How do you keep the data honest? (Data quality checklist)
Bad data quietly kills trust in documentation KPIs. Before you start optimizing, you need to know that your numbers mean something.
1. Event naming consistency
Problem: You accidentally ship both task_success and doc_task_complete for the same action, and your TTFS graphs lie.
Check: List distinct event names related to docs.
SELECT
  event_name,
  COUNT(*) AS events
FROM `my_project.my_dataset.events_*`
WHERE _TABLE_SUFFIX BETWEEN FORMAT_DATE('%Y%m%d', DATE_SUB(CURRENT_DATE(), INTERVAL 7 DAY))
                     AND FORMAT_DATE('%Y%m%d', CURRENT_DATE())
  AND event_name IN ('task_success', 'doc_task_complete', 'search', 'search_no_results')
GROUP BY event_name
ORDER BY events DESC;
If you see near-duplicates, fix your instrumentation and backfill or remap if possible.
2. Duplicate user identification
Problem: Users show up as different IDs in tickets and analytics, breaking deflection_by_view joins.
Check: Validate your identity stitching mapping (for example, between user_pseudo_id and internal user_id or email).
-- Simple sanity check: how many analytics IDs map to multiple internal users?

SELECT
  analytics_user_id,
  COUNT(DISTINCT internal_user_id) AS internal_users
FROM `my_project.identity.user_mapping`
GROUP BY analytics_user_id
HAVING internal_users > 1
ORDER BY internal_users DESC
LIMIT 50;
If multiple internal IDs map to the same analytics ID often, tighten your mapping logic.
3. Timezone alignment
Problem: Docs events are in UTC, tickets in local time, and your “ticket within 24 hours of view” window becomes nonsense.
Check: Confirm that your ETL normalizes timestamps to one timezone, typically UTC.
-- Quick comparison of hour-of-day distributions for events and tickets

SELECT
  'events' AS source,
  EXTRACT(HOUR FROM TIMESTAMP_MICROS(event_timestamp)) AS hour_utc,
  COUNT(*) AS count
FROM `my_project.my_dataset.events_*`
WHERE _TABLE_SUFFIX = FORMAT_DATE('%Y%m%d', DATE_SUB(CURRENT_DATE(), INTERVAL 1 DAY))
GROUP BY source, hour_utc

UNION ALL

SELECT
  'tickets' AS source,
  EXTRACT(HOUR FROM TIMESTAMP(created_at)) AS hour_utc,
  COUNT(*) AS count
FROM `my_project.support.zendesk_tickets`
WHERE DATE(created_at) = DATE_SUB(CURRENT_DATE(), INTERVAL 1 DAY)
GROUP BY source, hour_utc;
Look for wildly offset distributions that hint at timezone or DST issues.
4. Sampling awareness
Problem: You’re relying on sampled data from a UI instead of unsampled warehouse exports, and small metric changes are just noise.
Check: Confirm that all production documentation metrics come from unsampled warehouse data (GA4 BigQuery export, raw Segment events, etc.), not analytics UI exports.
In practice, this is more of a process check: audit your dashboard data sources and explicitly document “source = BigQuery unsampled events” in your dashboard metadata.
5. Bot and internal traffic filtering
Problem: Load testing, crawlers, and internal QA teams inflate views and skew TTFS and engagement.
Check: Filter known bots and internal IPs or user agents at query time, and keep a maintained list.
-- Example: filter internal users based on a known property

SELECT
  COUNT(*) AS total_docs_views,
  COUNTIF(is_internal_user) AS internal_docs_views
FROM (
  SELECT
    user_pseudo_id,
    event_timestamp,
    EXISTS (
      SELECT 1
      FROM UNNEST(user_properties) AS up
      WHERE up.key = 'user_type'
        AND up.value.string_value = 'internal'
    ) AS is_internal_user
  FROM `my_project.my_dataset.events_*`
  WHERE event_name = 'page_view'
    AND _TABLE_SUFFIX = FORMAT_DATE('%Y%m%d', DATE_SUB(CURRENT_DATE(), INTERVAL 1 DAY))
)
WHERE TRUE;
Then, in all KPI queries, add a WHERE NOT is_internal_user condition or its equivalent.
6. Backlog gaps and event drop-offs
Problem: Your tracking breaks silently after a deploy, and suddenly TTFS “improves” because task_success isn’t firing at all.
Check: Build a daily event volume check for key events.
-- Daily counts for key events to spot sudden drops

SELECT
  DATE(TIMESTAMP_MICROS(event_timestamp)) AS event_date,
  event_name,
  COUNT(*) AS events
FROM `my_project.my_dataset.events_*`
WHERE event_name IN ('page_view', 'task_success', 'search_no_results')
  AND _TABLE_SUFFIX BETWEEN FORMAT_DATE('%Y%m%d', DATE_SUB(CURRENT_DATE(), INTERVAL 14 DAY))
                       AND FORMAT_DATE('%Y%m%d', CURRENT_DATE())
GROUP BY event_date, event_name
ORDER BY event_date, event_name;
Feed this into a simple alert: if task_success drops to near zero between days, you investigate.
Targets, thresholds, and A/B testing documentation changes
Once you have reliable metrics, the next question is: what’s “good” and how do you get there without guessing?
How to set baselines
Baseline first, then targets. I normally use:
- Baseline window: the last 60–90 days before a major documentation push.
- Metrics to baseline: median TTFS, deflection_by_view, deflection_by_ticket_link, engagement (time_on_page, scroll depth), and doc ROI if you have the inputs.
Run your queries for that window and treat those numbers as “current reality,” not as something to be proud or ashamed of. You’re collecting starting conditions.
Example thresholds and goals
These are directional examples, not universal truths, but they’re reasonable starting points:
- TTFS: aim to reduce median TTFS by around 30% over 90 days for a target flow (for example, “getting first API call working”).
- Ticket deflection: if you’ve never seriously invested in docs, even a 15–20% deflection_by_view in the first 6 months is a strong sign you’re on track.
- Engagement: focus less on absolute time and more on directional change per article after improvements. A 10–20% increase in useful engagement (time combined with conversions) is a concrete early win.
- Doc ROI: once you calculate it, a positive ROI with at least 50–100% annualized is a defensible goal for a new docs initiative.
Simple A/B test plan for documentation changes
You don’t need a full experimentation platform to A/B test docs. A basic version works like this:
- Pick a specific flow: for example, “API authentication quickstart.” Identify the key URLs involved and the
task_successevent that marks success. - Create two variants: Version A (current docs), Version B (new structure, better examples, clearer prerequisites).
- Split traffic: randomly send 50% of users to A and 50% to B using either a server-side flag, client-side routing, or feature flagging tooling. Include a
doc_variantproperty ('A'or'B') on all related events. - Run for enough time: at least 2–4 weeks, or until each variant has several hundred users hitting the flow.
- Compare: TTFS,
task_successconversion rate, and resulting ticket deflection for users in variant A vs B.
If Variant B clearly lowers TTFS and ticket creation without hurting success rates, you roll it out and update your baseline.
Appendix A: Metrics-definition table (spreadsheet-ready)
This table is meant to be copy-pasteable into a CSV or spreadsheet. Each row is one metric with all the key metadata filled in.
| Metric Name | Precise Definition | Business Goal it ties to | Data Source (analytics event, support ticket system field, search logs) | Measurement Window (e.g., 28 days rolling) | Calculation Formula (mathematical) | Example Target | Collection Frequency |
|---|---|---|---|---|---|---|---|
| Time-to-first-success (TTFS) | Median time between a user’s first documentation page_view and their first task_success event within the window. | Reduce user time-to-value and friction when using the product. | Analytics events: page_view (page_location contains ‘/docs/’), task_success. | 28 days rolling | TTFS_user = timestamp(task_success) – timestamp(first_docs_page_view); TTFS = median(TTFS_user) | Reduce median TTFS by 30% over 90 days for target flow. | Daily |
| Ticket deflection by ticket link | Share of tickets that do not contain a knowledge base or docs reference. | Lower support volume attributable to issues answerable by docs. | Support tickets: help_center_article_id, via.channel. | Monthly | Deflection = 1 – (tickets_with_kb_reference / total_tickets) | Deflection > 20% after 6 months of focused docs work. | Monthly |
| Ticket deflection by view | Share of documentation views not followed by a ticket from the same user within 24 hours. | Quantify how often docs prevent tickets before they are created. | Analytics events: page_view (docs); Support tickets: created_at, requester_id. | 28 days rolling | Deflection = views_without_ticket_after_view / total_views | Deflection > 25% for core help-center sections. | Daily |
| Average time_on_page | Average engagement time on documentation pages per view. | Assess whether users are spending meaningful time on docs content. | Analytics events: page_view with engagement_time_msec, page_location. | 28 days rolling | Avg time_on_page = SUM(engagement_time_msec) / 1000 / views | Increase useful engagement by 10–20% on key articles after rewrites. | Daily |
| Median scroll depth | Median percentage scrolled on documentation pages. | Understand how far users read and whether content is consumed. | Analytics events: scroll with percent_scrolled, page_location. | 28 days rolling | Median scroll_depth = median(percent_scrolled) per page | Median scroll_depth > 60% on critical guides. | Daily |
| Click-to-expand rate | Share of documentation page impressions where accordion or expandable content is clicked. | Gauge interaction with collapsible details and FAQs. | Analytics events: click_expand (component_type = ‘accordion’); page_view. | 28 days rolling | Click-to-expand rate = clicks / impressions | > 30% click-to-expand on FAQ sections for popular topics. | Weekly |
| Search no-results rate | Share of documentation searches that return zero results. | Identify missing content and search configuration gaps. | Analytics events: search, search_no_results; search logs with result_count. | 28 days rolling | No-results rate = search_no_results / total_searches | < 10% no-results rate for total search volume. | Weekly |
| Doc ROI | Net financial value created by documentation relative to its operational cost. | Justify and prioritize investment in documentation. | Derived from ticket deflection metrics, time-saved estimates, finance inputs. | Quarterly | ROI_value = (deflected_tickets * avg_cost_per_ticket + time_saved_per_user_hours * hourly_value * affected_users) – documentation_operational_costs; ROI% = ROI_value / documentation_operational_costs | ROI% > 50–100% over each 12-month period. | Quarterly |
Appendix B: Example CSV export schema for raw events
This is a simplified schema you can use as a target when exporting analytics and tickets into your warehouse. Adjust field types and names to your stack.
| Column Name | Type | Description |
|---|---|---|
| event_id | STRING | Unique identifier for the event. |
| event_name | STRING | Name of the event (page_view, task_success, scroll, click_expand, search, search_no_results). |
| event_timestamp | TIMESTAMP | Event time in UTC. |
| user_id | STRING | Stable user identifier (if available). |
| user_pseudo_id | STRING | Anonymous or device-level ID (GA4 style). |
| session_id | STRING | Session identifier, if defined. |
| page_location | STRING | Full URL of the page viewed (used to identify ‘/docs/’ pages). |
| engagement_time_msec | INTEGER | Engagement time reported by analytics (milliseconds). |
| percent_scrolled | INTEGER | Scroll depth as a percent (0–100) for scroll events. |
| component_type | STRING | Component interacted with (e.g., ‘accordion’). |
| search_term | STRING | User-entered search query for docs search. |
| result_count | INTEGER | Number of search results returned. |
| ticket_id | STRING | Support ticket ID (for ticket events or joined data). |
| ticket_created_at | TIMESTAMP | Ticket creation time in UTC. |
| via_channel | STRING | Ticket channel (via.channel in Zendesk exports). |
| help_center_article_id | STRING | Referenced article ID when ticket created from a help-center article. |
| locale | STRING | Locale (e.g., ‘en-US’, ‘de-DE’) associated with the event or user. |
| product | STRING | Product or module tag associated with the docs page. |
| version | STRING | Product or API version tag for the docs page. |
| is_internal_user | BOOLEAN | Flag for internal traffic (employees, QA). |
| doc_variant | STRING | Variant label for A/B tests (e.g., ‘A’, ‘B’). |
Appendix C: Two short code snippets for common analytics setups
1) GA4 event mapping snippet (pseudo-JS)
This shows how you might send the key events from your docs front-end using the GA4 gtag interface.
// Track a docs page view
gtag('event', 'page_view', {
  page_title: document.title,
  page_location: window.location.href,
  page_path: window.location.pathname,
  content_group: 'docs'
});

// Track scroll depth at 25%, 50%, 75%, 100%
window.addEventListener('scroll', () => {
  const scrolled = (window.scrollY + window.innerHeight) / document.body.scrollHeight;
  const percent = Math.round(scrolled * 100);

  if (percent === 25 || percent === 50 || percent === 75 || percent === 100) {
    gtag('event', 'scroll', {
      page_location: window.location.href,
      percent_scrolled: percent
    });
  }
});

// Track task success when user completes a tutorial or first API call
function trackTaskSuccess(taskName) {
  gtag('event', 'task_success', {
    page_location: window.location.href,
    task_name: taskName
  });
}

// Track click-to-expand on accordion components
document.addEventListener('click', (e) => {
  const accordion = e.target.closest('[data-accordion]');
  if (accordion) {
    gtag('event', 'click_expand', {
      page_location: window.location.href,
      component_type: 'accordion',
      component_id: accordion.getAttribute('id') || ''
    });
  }
});
2) Example BigQuery query for search no-results
-- Search queries with no results for docs search (GA4)

WITH searches AS (
  SELECT
    DATE(TIMESTAMP_MICROS(event_timestamp)) AS search_date,
    (SELECT value.string_value FROM UNNEST(event_params)
      WHERE key = 'search_term') AS search_term,
    (SELECT value.int_value FROM UNNEST(event_params)
      WHERE key = 'result_count') AS result_count
  FROM `my_project.my_dataset.events_*`
  WHERE
    event_name = 'search'
    AND _TABLE_SUFFIX BETWEEN FORMAT_DATE('%Y%m%d', DATE_SUB(CURRENT_DATE(), INTERVAL 28 DAY))
                         AND FORMAT_DATE('%Y%m%d', CURRENT_DATE())
)

SELECT
  search_term,
  COUNT(*) AS searches,
  SUM(CASE WHEN result_count = 0 THEN 1 ELSE 0 END) AS no_result_searches,
  SAFE_DIVIDE(SUM(CASE WHEN result_count = 0 THEN 1 ELSE 0 END), COUNT(*)) AS no_results_rate
FROM searches
GROUP BY search_term
HAVING searches >= 10
ORDER BY no_results_rate DESC, searches DESC
LIMIT 100;
Implementation checklist: what to do this week
You don’t have to build everything at once. If I were sitting next to you at your desk, here’s the three-step starter plan I’d push for:
- Instrument the core events: Make sure
page_viewfor/docs/,task_success,scroll,click_expand, andsearch/search_no_resultsare firing with the right parameters, and that support tickets includehelp_center_article_idandvia.channel. - Validate the data: Run the data quality queries for event volumes, duplicates, timezone alignment, and internal traffic. Fix anything that looks off before you start sharing charts.
- Build the KPI tiles: In your BI tool, wire up four tiles: TTFS (median), ticket deflection_by_view, engagement score (composite of time_on_page and scroll depth), and doc ROI (even if it’s a rough first estimate). Put them on one dashboard and review them weekly with your docs and support leads.
Once those pieces are in place, the conversation around documentation changes. You’re no longer arguing about taste or individual anecdotes; you’re steering based on real documentation metrics and documentation KPIs that tie back to doc ROI. That’s when your work starts to feel less like invisible glue and more like an acknowledged, measurable part of the product.