The Chrome Developer Tools is an essential suite of web development tools provided by the Google Chrome browser. It empowers developers and aspiring developers to efficiently debug, analyze, and optimize web pages and web applications. With its wide range of components and functionalities, Chrome Developer Tools is a must-have resource for anyone involved in web development.
In this comprehensive guide, we will explore each component of Chrome Developer Tools in detail and uncover their functionalities. Whether you’re a seasoned developer looking to enhance your debugging skills or a beginner embarking on your web development journey, this article will provide you with a solid understanding of how to leverage the power of Chrome Developer Tools.
So, whether you’re a front-end developer, back-end developer, or a web enthusiast passionate about optimizing web experiences, let’s embark on this journey to master Chrome Developer Tools together. By the end of this guide, you’ll have the tools and knowledge to elevate your web development skills and create exceptional web experiences. Let’s get started!
Getting Started with Chrome Developer Tools
Before we dive into the intricacies of Chrome Developer Tools, let’s begin by understanding how to access and navigate the toolset. This section will provide you with a step-by-step guide to getting started with Chrome Developer Tools.
Accessing Chrome Developer Tools:
- Open the Google Chrome browser on your computer.
- Navigate to the webpage or web application you want to inspect and debug.
- To open Chrome Developer Tools, you have several options:
a. Right-click on any element on the webpage and select “Inspect” from the context menu.
b. Press “Ctrl+Shift+I” (Windows/Linux) or “Cmd+Option+I” (Mac) on your keyboard.
c. Click on the three-dot menu icon in the top-right corner of the browser window, go to “More Tools,” and select “Developer Tools.”
Exploring the Chrome Developer Tools interface:
- Upon opening Chrome Developer Tools, you’ll see a split-screen interface.
- The main portion of the screen is occupied by the currently active panel (defaulting to the Elements panel).
- On the left-hand side, you’ll find a vertical tabbed sidebar with icons representing various panels and tools.
- Familiarize yourself with the icons and their corresponding panel names: Elements, Console, Sources, Network, Performance, Memory, Application, Security, and more.
- You can switch between panels by clicking on the respective icons in the sidebar or using the corresponding keyboard shortcuts.
Keyboard shortcuts for efficient navigation:
- Chrome Developer Tools offers a range of keyboard shortcuts to streamline your workflow. Here are a few essential shortcuts:
a. Ctrl/Cmd + Shift + C: Toggle element inspection mode.
b. Ctrl/Cmd + Shift + J: Open the Console panel.
c. Ctrl/Cmd + Shift + E: Toggle the Device Toolbar.
d. Ctrl/Cmd + Shift + F: Search for specific content within the currently active panel.
e. Ctrl/Cmd + 1-9: Switch between panels based on their order in the sidebar. - Familiarize yourself with these shortcuts and explore additional shortcuts available for specific panels.
As you become comfortable with accessing and navigating Chrome Developer Tools, you’re ready to explore its diverse components. In the following sections, we will delve into each panel and uncover their unique functionalities. By mastering these tools, you’ll be able to efficiently inspect, debug, and optimize your web applications. So, let’s proceed to the first component: the Elements panel.
Elements Panel:
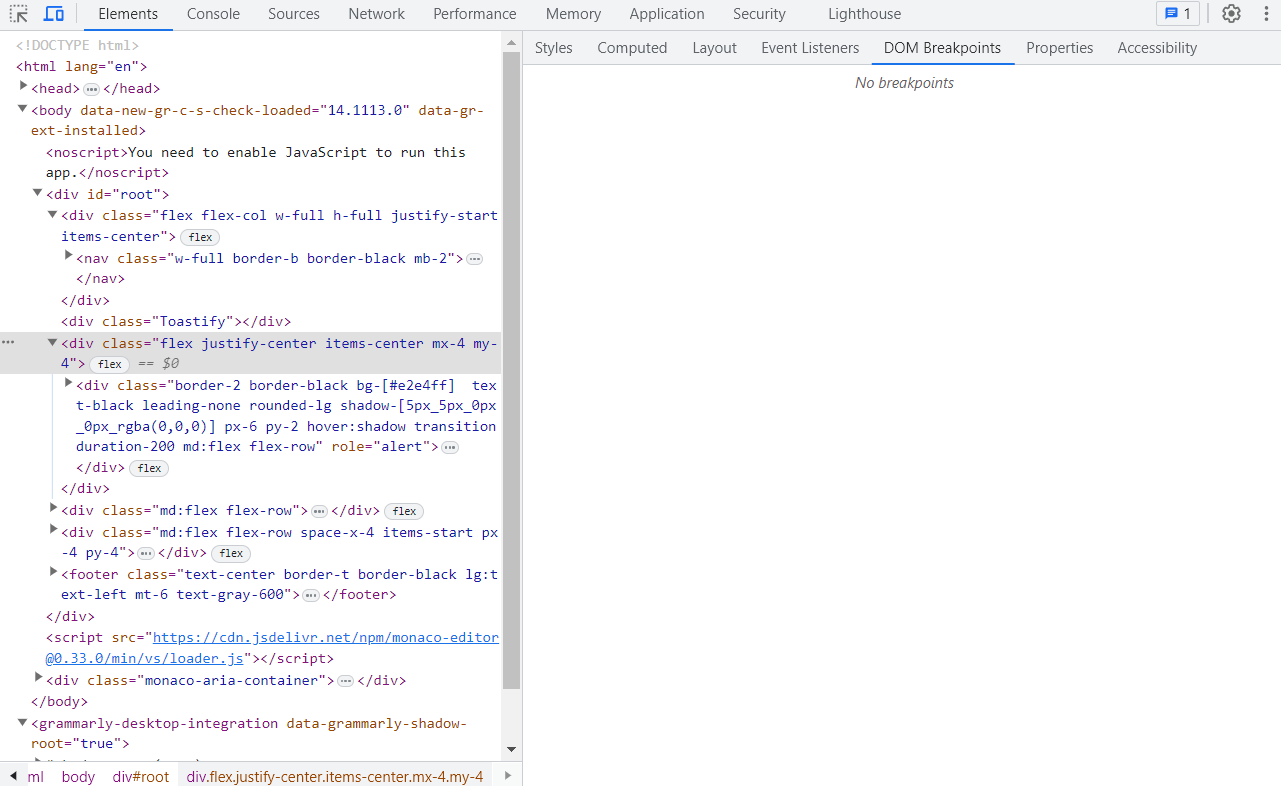
The Elements panel in Chrome Developer Tools is a powerful tool that allows you to inspect, modify, and understand the HTML and CSS elements of a web page. It provides a comprehensive view of the Document Object Model (DOM) structure, allowing you to analyze and manipulate individual elements and their associated styles. Let’s dive into the details of the Elements panel and explore its functionalities.
Inspecting and Modifying HTML Elements:
In the Elements panel of Chrome Developer Tools, you have the ability to inspect and modify HTML elements of a web page. This feature allows you to gain insights into the structure and properties of individual elements, making it easier to understand and manipulate the webpage’s content.
- Navigating the DOM Tree:
- The DOM tree represents the hierarchical structure of HTML elements on the web page. It is displayed on the left-hand side of the Elements panel.
- You can expand or collapse elements in the tree to navigate through the structure of the webpage.
- To inspect a specific element, you can either:
- Click on the desired element in the DOM tree.
- Use the mouse cursor to hover over elements in the viewport, and the corresponding HTML element will be highlighted in the DOM tree.
- Element Properties and Attributes:
- When you select an element in the DOM tree, the right-hand panel of the Elements panel displays the element’s associated properties, attributes, and styles.
- You can expand the properties to view additional details and values associated with the element.
- The properties section provides a detailed view of the selected element’s attributes, such as class, ID, name, and more.
- The attributes section displays all the attributes present on the selected element, including custom attributes.
- By inspecting the properties and attributes of an element, you can better understand its role and behavior within the webpage.
- Style Inspection and Modification:
- The Styles section of the Elements panel allows you to inspect and modify the CSS styles applied to the selected element.
- In this section, you can view the applied styles, including inline styles and styles inherited from CSS rules.
- Each CSS property is displayed with its corresponding value, and you can expand the property to view additional details.
- To modify a style property, you can click on the property value and enter a new value. The changes will be applied immediately, allowing you to preview the effect on the webpage.
- You can also add new CSS properties by clicking on the “+” icon within the Styles section and entering the property name and value.
- By inspecting and modifying CSS styles, you can experiment with different designs, fine-tune the appearance of elements, and troubleshoot styling issues.
- Highlighting Elements:
- In the Elements panel, you have the ability to visually highlight elements on the webpage.
- By hovering over elements in the DOM tree or styles section, the corresponding element on the webpage will be highlighted.
- This highlighting feature helps you identify specific elements on the webpage that you are inspecting or modifying.
The ability to inspect and modify HTML elements in the Elements panel is a fundamental feature for web developers. It provides a comprehensive view of the webpage’s structure, properties, and styles, allowing you to gain insights, make changes, and debug issues efficiently. By utilizing this powerful tool, you can better understand and manipulate the elements of a web page to create visually appealing and functional websites.
Manipulating CSS Styles:
In the Elements panel of Chrome Developer Tools, you have the capability to manipulate CSS styles applied to HTML elements. This functionality empowers you to experiment with different styles, fine-tune the appearance of elements, and troubleshoot styling issues. Let’s explore the various ways you can manipulate CSS styles in the Elements panel.
- Viewing Applied Styles:
- When you select an element in the DOM tree, the Styles section of the Elements panel displays the CSS styles applied to that element.
- Each CSS property is listed along with its corresponding value.
- You can expand the properties to view additional details and values associated with each style property.
- Modifying Existing Styles:
- To modify a CSS style, simply click on the value of the style property you wish to change.
- An editable field will appear, allowing you to enter a new value.
- As you type, the webpage will update in real-time, providing an immediate preview of the changes you make.
- This live editing feature enables you to experiment with different style values and observe their effects instantaneously.
- Adding New Styles:
- In addition to modifying existing styles, you can also add new CSS properties to elements.
- Within the Styles section, click on the “+” icon to create a new style property.
- Enter the desired CSS property name and its corresponding value.
- As soon as you add the new style, the webpage will reflect the changes accordingly.
- Toggling Styles and Disabling CSS Rules:
- The Styles section allows you to toggle the visibility of individual style properties or disable entire CSS rules.
- By clicking on the checkbox next to a style property, you can enable or disable it to observe its impact on the element’s appearance.
- Similarly, you can toggle the visibility of a CSS rule by clicking on the eye icon next to it.
- Toggling styles and disabling CSS rules can help you troubleshoot conflicting or unwanted styles and refine the overall design.
- Force Element States:
- The Elements panel allows you to simulate specific element states, such as :hover or :active, to inspect their corresponding styles.
- By right-clicking on an element within the DOM tree, you can choose the “Force element state” option and select the desired state.
- This feature helps you understand and debug the styling of elements under different user interactions.
Analyzing and understanding the Box Model:
The Elements panel in Chrome Developer Tools provides a visual representation of the box model, allowing you to analyze and understand how elements are sized and positioned on a webpage. The box model comprises the content area, padding, border, and margin of an element. By inspecting the box model properties, you can troubleshoot layout issues, ensure proper spacing, and comprehend how different CSS properties affect the rendering of elements. Let’s delve into analyzing and understanding the box model in detail.
- Viewing the Box Model:
- When you select an element in the Elements panel, the Computed tab within the Styles section displays the box model properties.
- The box model is presented as a visual diagram, illustrating the content area, padding, border, and margin of the selected element.
- Each section of the box model is depicted with dimensions, providing a clear representation of how they contribute to the overall size and position of the element.
- Content Area:
- The content area represents the space occupied by the actual content, such as text, images, or nested elements, within the element.
- In the box model diagram, the content area is denoted by the innermost rectangle.
- By understanding the content area, you can determine the available space for displaying the element’s content.
- Padding:
- Padding refers to the space between the content area and the element’s border.
- It provides internal spacing, separating the content from the element’s edges.
- In the box model diagram, padding is displayed as a colored area surrounding the content area.
- Border:
- The border surrounds the padding and content area, creating a visible boundary for the element.
- The border can have different styles, colors, and widths.
- In the box model diagram, the border is depicted as a line surrounding the padding area.
- Margin:
- The margin represents the space between the element and its neighboring elements.
- It provides external spacing, controlling the distance between elements.
- In the box model diagram, the margin is illustrated as a transparent area surrounding the border.
- Understanding Dimensions and Box Model Properties:
- The box model properties, such as width, height, padding, border, and margin, directly influence the dimensions and positioning of elements.
- By inspecting these properties in the Computed tab, you can understand how they contribute to the overall size and spacing of the element.
- Adjusting these properties can help you achieve the desired layout and alignment of elements on the webpage.
Analyzing and understanding the box model is essential for creating well-structured and visually appealing webpages.
Console Panel:
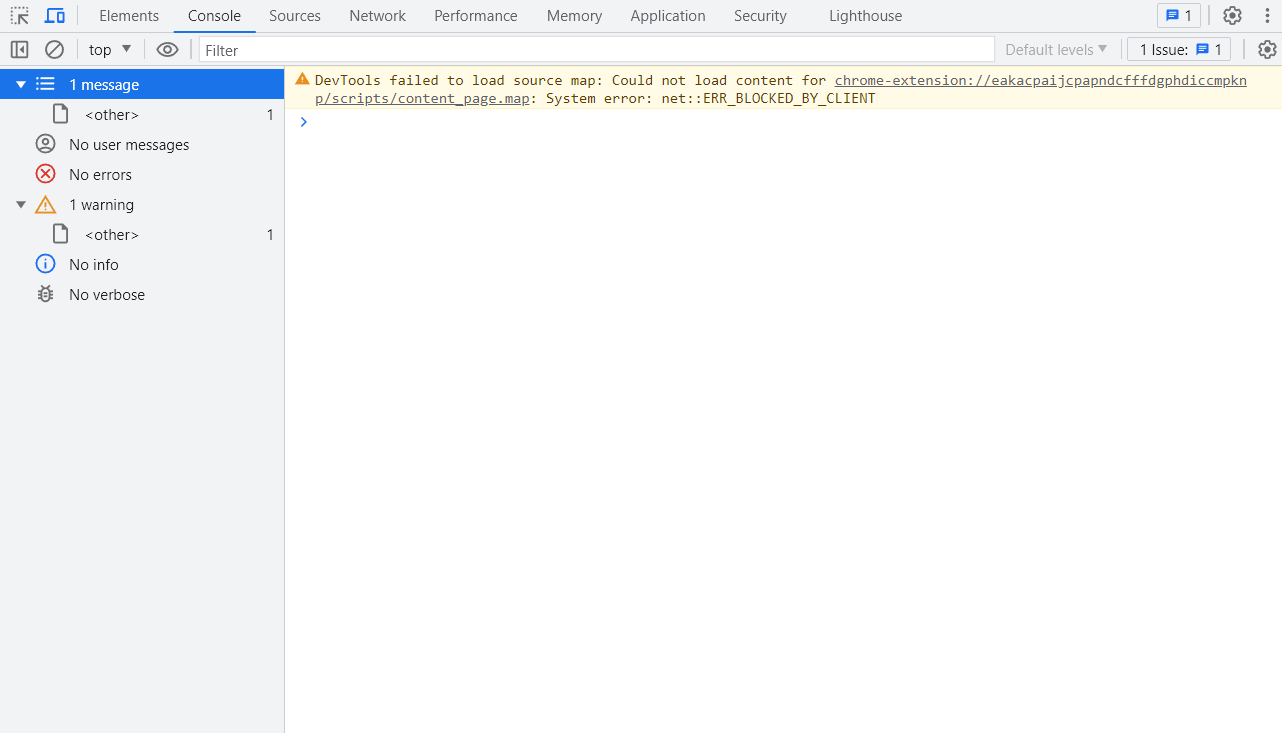
The Console panel in Chrome Developer Tools is a powerful tool that allows developers to interact with the webpage, debug JavaScript code, log messages, and test code snippets. It serves as a valuable resource for developers to understand the behavior of their web applications, diagnose issues, and optimize performance. In this section, we’ll explore the various functionalities of the Console panel in detail.
- Logging Messages:
The primary function of the Console panel is to log messages from the webpage’s JavaScript code. Developers can use theconsole.log()method to output messages, objects, or any other data to the console. This feature is particularly useful for debugging purposes as it allows developers to inspect the values of variables, check for errors, and monitor the flow of code execution.
// Logging messages to the console
console.log('Hello, World!');
const num = 42;
console.log('The value of num is:', num);- Interacting with the Webpage:
The Console panel enables developers to interact with the webpage directly through JavaScript commands. You can execute JavaScript code in the Console, and the results will be displayed immediately. This feature allows you to test code snippets, modify the webpage’s behavior, and quickly verify JavaScript expressions.
// Interacting with the webpage
document.querySelector('h1').style.color = 'blue'; // Change heading color to blue
document.body.classList.add('dark-mode'); // Apply a "dark-mode" CSS class to the body- Debugging JavaScript:
The Console panel is an essential tool for JavaScript debugging. You can set breakpoints in your code using thedebuggerstatement or by clicking the line number in the Sources panel. When the code execution reaches the breakpoint, it will pause, and you can inspect variables, step through the code, and observe the program’s state.
// Debugging JavaScript
function add(a, b) {
  debugger; // Setting a breakpoint
  return a + b;
}
const result = add(2, 3);
console.log('Result:', result);- Error and Warning Messages:
If there are any JavaScript errors or warnings on the webpage, the Console panel will display them along with the corresponding line number and source file. This information is crucial for identifying and fixing issues in your code. - Network Messages:
The Console panel also provides network-related messages, showing details about network requests and responses. It allows you to monitor HTTP requests made by the webpage, inspect their headers, payloads, and response status. - Clearing the Console:
To keep the Console panel tidy, you can clear the logged messages by clicking the “Clear console” button or by pressingCtrl + L(Windows/Linux) orCmd + K(macOS). - Filtering Messages:
The Console panel allows you to filter the messages based on their type (log, error, warning, info, debug) or by using specific keywords. Filtering helps to focus on specific types of messages and facilitates the debugging process. - Advanced Console Methods:
Apart fromconsole.log(), the Console panel supports various other methods for specialized logging and debugging, such asconsole.error(),console.warn(),console.info(),console.debug(), andconsole.table().
// Advanced Console methods
console.error('This is an error message.');
console.warn('This is a warning message.');
console.info('This is an informational message.');
console.debug('This is a debug message.');
console.table([{ name: 'John', age: 30 }, { name: 'Jane', age: 28 }]);The Console panel is a fundamental tool for web developers, providing a means to log messages, interact with the webpage, debug JavaScript code, and monitor network activity. By leveraging its features effectively, you can identify and fix issues, optimize performance, and gain valuable insights into the behavior of your web applications.
Sources Panel:
The Sources panel in Chrome Developer Tools provides a comprehensive set of tools for debugging and analyzing JavaScript code.
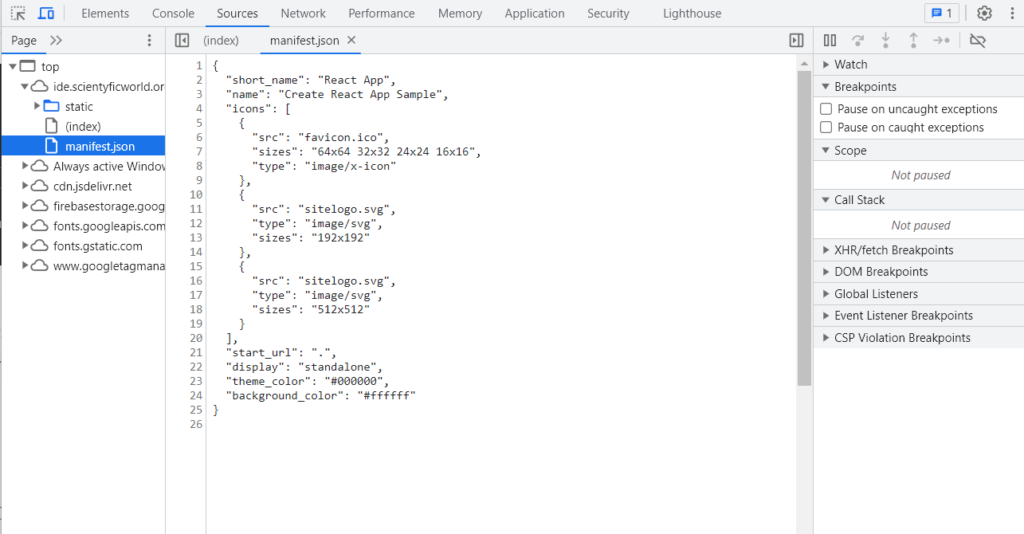
It offers features that allow developers to navigate through source files, set breakpoints, inspect variables, and step through code execution. Understanding the functionalities of the Sources panel is crucial for efficient debugging and optimizing the performance of web applications. Let’s explore the various features of the Sources panel in detail.
- File Navigation and Source Files:
The Sources panel displays the source files of your web application, including HTML, JavaScript, and CSS files. You can navigate through the file structure and view the contents of each file. The panel organizes the files in a tree-like structure, making it easy to locate and select the desired file. - Setting Breakpoints:
Breakpoints are markers placed within the source code that pause the execution of JavaScript when reached, allowing you to inspect variables, evaluate expressions, and track the flow of your code. The Sources panel allows you to set breakpoints by clicking on the line numbers or using the context menu. You can set different types of breakpoints, such as line-of-code breakpoints, conditional breakpoints, and DOM event breakpoints. - Debugging and Stepping through Code:
Once breakpoints are set, you can initiate debugging by reloading the webpage or triggering the specific events that activate the breakpoints. When the code execution reaches a breakpoint, it pauses, and the Sources panel provides a range of debugging controls.- Step Over (F10): This control allows you to move to the next line of code, without stepping into any function calls on that line.
- Step Into (F11): This control enables you to step into a function call and navigate through its execution.
- Step Out (Shift + F11): If you are currently inside a function, this control allows you to step out of the function and return to its caller.
- Resume (F8): Resumes the normal code execution, bypassing any breakpoints until the next one is encountered.
- Call Stack and Scope Variables:
The Sources panel provides access to the call stack, which shows the sequence of function calls leading to the current point of execution. It allows you to navigate through the call stack, inspect the values of variables at different stack frames, and understand how the code flows.
You can also view and modify the values of variables within the current scope. The Scope section in the right sidebar of the Sources panel displays the variables available at the current point of execution. You can expand the scope and explore the variables’ values, types, and references. - Watch Expressions and Conditional Breakpoints:
The Sources panel allows you to add watch expressions, which are custom expressions or variables that you want to monitor during debugging. You can add watch expressions by right-clicking and selecting “Add to Watch” or by typing the expression in the Watch section of the right sidebar. The values of the watch expressions are updated as you step through the code.
Conditional breakpoints provide a way to specify a condition that must be met for the breakpoint to pause the code execution. You can right-click on a breakpoint and set a condition based on variables, expressions, or function return values. This feature is especially useful when you want to break the execution only when certain conditions are met. - Blackboxing and Pretty-printing:
The Sources panel allows you to blackbox specific scripts or libraries. Blackboxing prevents those scripts from pausing the execution or stepping into them while debugging, making it easier to focus on your application’s code.
Pretty-printing is a feature that formats minified or compressed JavaScript code into a more readable format, making it easier to understand and debug. - Network Requests and Resource Loading:
The Sources panel also provides information about network requests made by the webpage. It allows you to inspect the details of each request, such as headers, response data, and timing. This information can be valuable for optimizing network performance and identifying potential bottlenecks.
The Sources panel in Chrome Developer Tools offers a wide range of features and tools for efficient JavaScript debugging and analysis.
Network Panel:
The Network panel in Chrome Developer Tools provides a wealth of information about the network activity of a web application. It allows developers to monitor and analyze network requests, inspect response headers, view request and response payloads, and measure performance metrics.
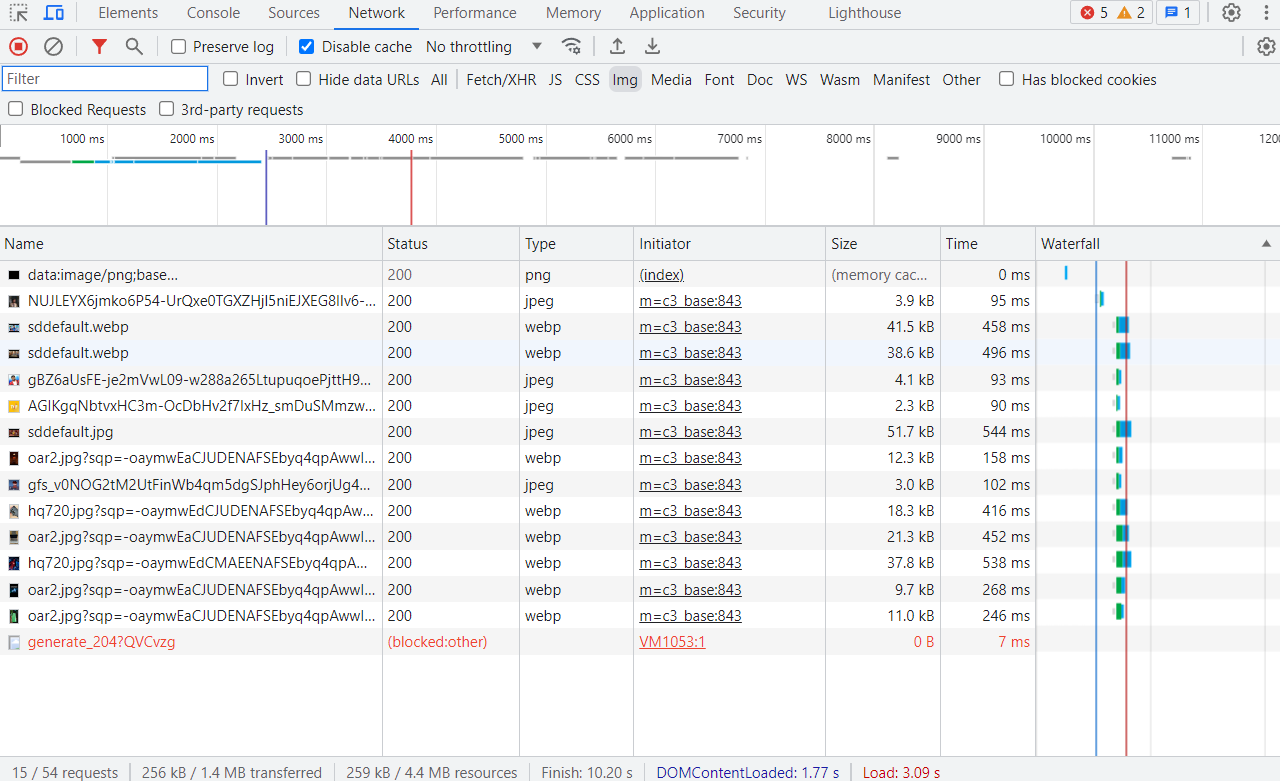
Understanding the functionalities of the Network panel is crucial for optimizing network performance and diagnosing issues related to network communication. Let’s explore the various features of the Network panel in detail.
- Recording Network Activity:
To start monitoring network requests, you need to enable the Network panel by clicking on the “Network” tab in Chrome Developer Tools. Once enabled, the panel will start recording all network activity that occurs while the webpage is loaded or refreshed. - Inspecting Network Requests:
The Network panel displays a detailed list of network requests made by the web application. Each request is represented as a row in the panel and provides essential information, such as the request URL, status code, size, and timing. - Request and Response Headers:
By selecting a specific network request, you can inspect its headers in the Headers tab. The headers section displays both request headers (sent by the browser) and response headers (received from the server). It includes information such as content type, caching directives, cookies, and more. - Request and Response Payloads:
The Network panel allows you to view the request and response payloads for each network request. The payload tab provides a detailed view of the data exchanged between the client and the server. For requests with payloads, such as POST or PUT requests, you can inspect the sent data. Similarly, for responses, you can examine the received data, including HTML, JSON, XML, or other content types. - Timing and Performance Metrics:
The Network panel provides valuable performance metrics related to network activity. It includes information such as request timing, latency, DNS lookup time, connection time, SSL negotiation time, and total transfer time. These metrics can help identify potential bottlenecks and optimize the loading speed of the web application. - Filtering and Sorting Requests:
To make it easier to analyze network activity, the Network panel offers various filtering and sorting options. You can filter requests based on different criteria, such as request type (XHR, fetch, document, image), status code, domain, or content type. Additionally, you can sort requests by different parameters, such as time, size, or duration. - Request Blocking and Throttling:
The Network panel allows you to simulate different network conditions to test your web application’s behavior. You can block specific requests to observe how your application handles errors or unavailable resources. Additionally, you can throttle the network speed to simulate slower connections and assess the performance of your application under different network conditions. - Importing and Exporting Network Requests:
The Network panel provides options to import and export network requests. You can export requests as a HAR (HTTP Archive) file, which includes detailed information about each request and response. This feature is particularly useful for sharing network data with colleagues or for later analysis.
Performance Panel:
The Performance panel in Chrome Developer Tools is a powerful tool for analyzing and optimizing the performance of web applications.
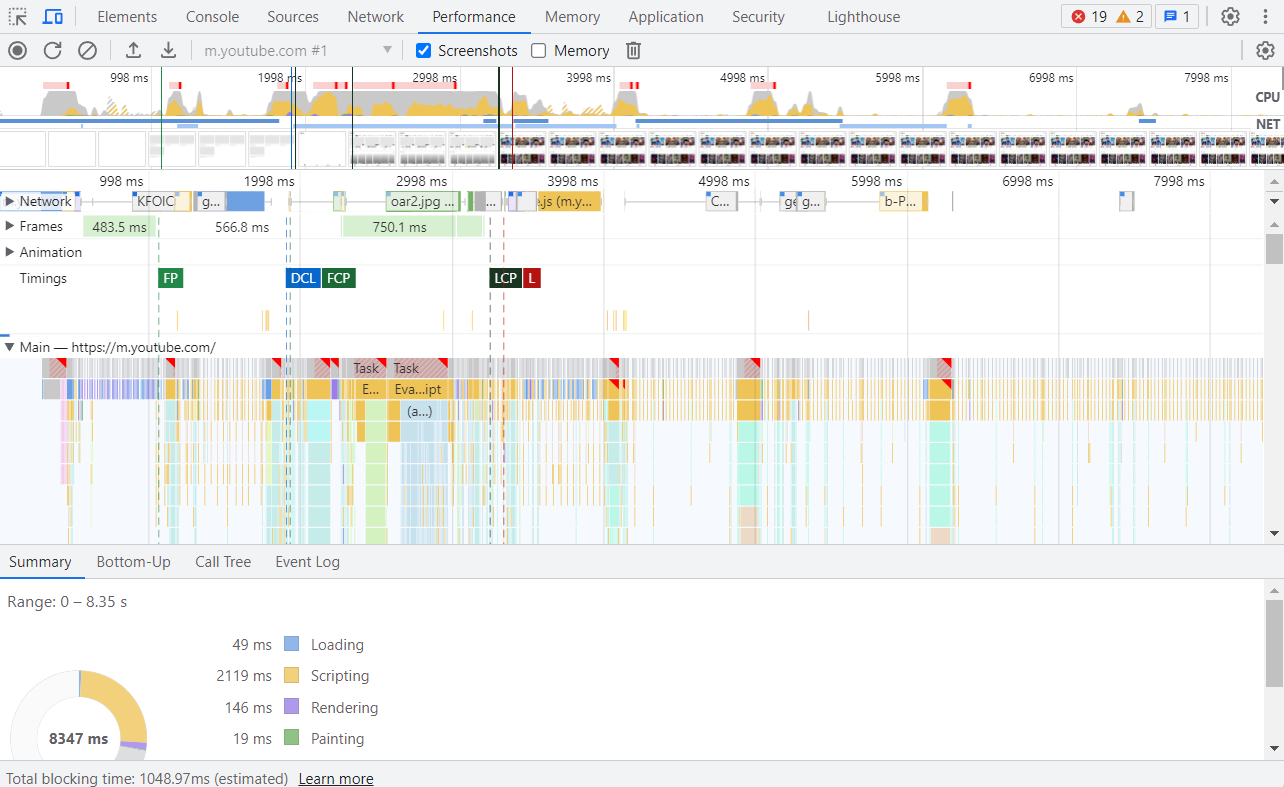
It provides insights into the loading speed, rendering, scripting, and memory consumption of a webpage. By understanding the functionalities of the Performance panel, developers can identify performance bottlenecks, optimize code execution, and improve the overall user experience. Let’s explore the various features of the Performance panel in detail.
- Recording Performance:
To start analyzing the performance of a webpage, you need to enable the Performance panel by clicking on the “Performance” tab in Chrome Developer Tools. Once enabled, the panel will start recording various performance metrics and events. - Performance Overview:
The Performance panel provides a high-level overview of the page’s performance. It displays a timeline that visualizes the different activities occurring during the loading and rendering process. The timeline includes events such as network requests, scripting, rendering, painting, and user interactions. - Analyzing CPU Activity:
The CPU profiling feature in the Performance panel allows you to analyze how the CPU is utilized during the execution of JavaScript code. It helps identify expensive functions, long-running operations, and performance bottlenecks that may affect the responsiveness of the webpage. - Inspecting Network Performance:
The Performance panel provides detailed information about network performance. It shows network-related events, such as DNS lookup, connection establishment, request, and response times. This information helps in identifying network-related bottlenecks and optimizing the loading speed of the webpage. - Timeline View:
The Timeline view in the Performance panel offers a detailed breakdown of activities that occur during the loading and rendering of a webpage. It allows you to analyze the different phases, such as loading resources, parsing HTML, executing JavaScript, rendering, and painting. By examining the timeline, you can identify areas where optimizations can be made to improve the performance. - JavaScript Profiling:
The Performance panel enables JavaScript profiling, which allows you to identify and analyze performance issues within your JavaScript code. By recording the JavaScript activity, you can identify slow functions, excessive memory usage, and other performance bottlenecks. The panel provides visual representations of the call stack, heap allocations, and execution time for each function. - Memory Analysis:
The Memory analysis feature in the Performance panel allows you to analyze memory consumption and identify potential memory leaks in your web application. It provides insights into JavaScript heap allocations, memory snapshots, and object allocation timelines. By analyzing memory usage patterns, you can optimize memory usage and improve the overall performance of your application. - User Interactions and Frames:
The Performance panel captures user interactions, such as clicks, scrolls, and keyboard events, and correlates them with the performance data. This helps in understanding the impact of user interactions on the webpage’s responsiveness and allows for optimization of event handling and rendering. - Flame Charts and Waterfall View:
The Performance panel offers flame charts and a waterfall view to visualize the performance data. Flame charts provide a graphical representation of the call stack and execution time, making it easier to identify performance hotspots. The waterfall view displays the sequence and timing of network requests, scripting, rendering, and painting activities. - Exporting Performance Data:
The Performance panel allows you to export performance data as a JSON or a Jankiness Report (Jankiness refers to visual stuttering or jumpy behavior in the user interface). Exporting the data enables you to share performance profiles with colleagues, analyze them offline, or compare different profiling sessions.
Memory Panel:
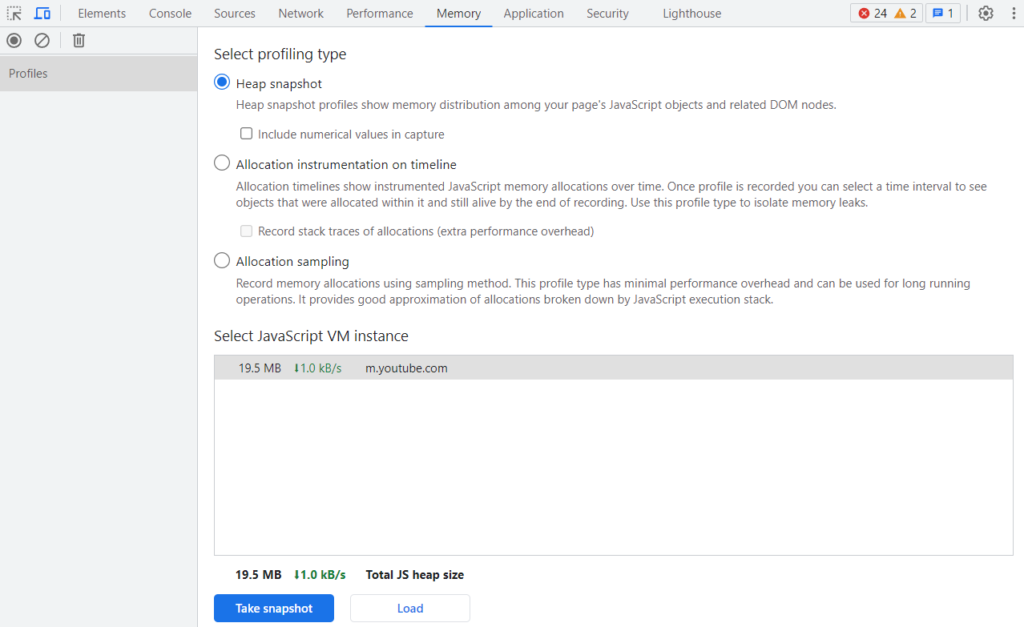
The Memory panel in Chrome Developer Tools provides powerful tools for analyzing and optimizing the memory consumption of web applications. It allows developers to monitor memory usage, detect memory leaks, and understand how memory is allocated and released during runtime. By understanding the functionalities of the Memory panel, developers can optimize memory usage, improve performance, and ensure the stability of their applications. Let’s explore the various features of the Memory panel in detail.
- Memory Snapshot:
The Memory panel allows you to take memory snapshots of your web application. A memory snapshot captures the current state of the JavaScript heap, including all objects and their relationships. By taking multiple snapshots at different points in time, you can compare them to identify memory leaks, detect objects that are not being garbage collected, and analyze memory growth patterns. - Heap Allocation Tracking:
The Memory panel provides heap allocation tracking, which allows you to monitor how memory is allocated and deallocated during runtime. It shows a timeline of memory allocations, giving you insights into which parts of your code are responsible for allocating memory. By analyzing heap allocation patterns, you can optimize memory usage and reduce unnecessary allocations. - Dominator Tree:
The Memory panel presents a dominator tree, which represents the object graph and shows which objects are retaining the most memory. The dominator tree helps identify memory-holding objects and understand the relationships between objects. By analyzing the dominator tree, you can pinpoint memory leaks and optimize memory usage by releasing unnecessary references. - Object Allocation Tracking:
The Memory panel allows you to track object allocations, which shows the call stack for each allocation. It helps identify the code paths that create objects and allows you to trace back to the source of memory allocations. By analyzing object allocation information, you can optimize memory usage by minimizing object creation and improving object reuse. - Allocation Profile:
The Memory panel provides an allocation profile, which shows a breakdown of memory allocations by constructor or function. It allows you to identify the functions or constructors that are responsible for significant memory allocations. By analyzing the allocation profile, you can optimize memory usage by optimizing memory-intensive functions or constructors. - Garbage Collection:
The Memory panel provides insights into the garbage collection process and helps you understand how memory is reclaimed by the JavaScript engine. It shows information about major garbage collections, including the time taken and the amount of memory freed. Understanding garbage collection can help you optimize memory usage and minimize interruptions caused by garbage collection cycles. - Retained Size:
The Memory panel displays the retained size of objects, which represents the amount of memory that would be freed if an object and all objects it references were garbage collected. It helps identify objects that are retaining a significant amount of memory and allows you to optimize memory usage by releasing unnecessary references. - Comparing Snapshots:
The Memory panel allows you to compare memory snapshots, enabling you to identify changes in memory usage between different snapshots. Comparing snapshots helps in detecting memory leaks, tracking down memory growth, and verifying the effectiveness of memory optimization techniques. - Exporting Memory Snapshots:
The Memory panel provides options to export memory snapshots, allowing you to share them with colleagues or analyze them offline. You can export snapshots in various formats, such as JSON or the Chrome DevTools format. Exported snapshots can be useful for in-depth analysis and debugging of memory-related issues.
Application Panel:
The Application panel in Chrome Developer Tools provides a set of powerful tools for inspecting and debugging web applications.
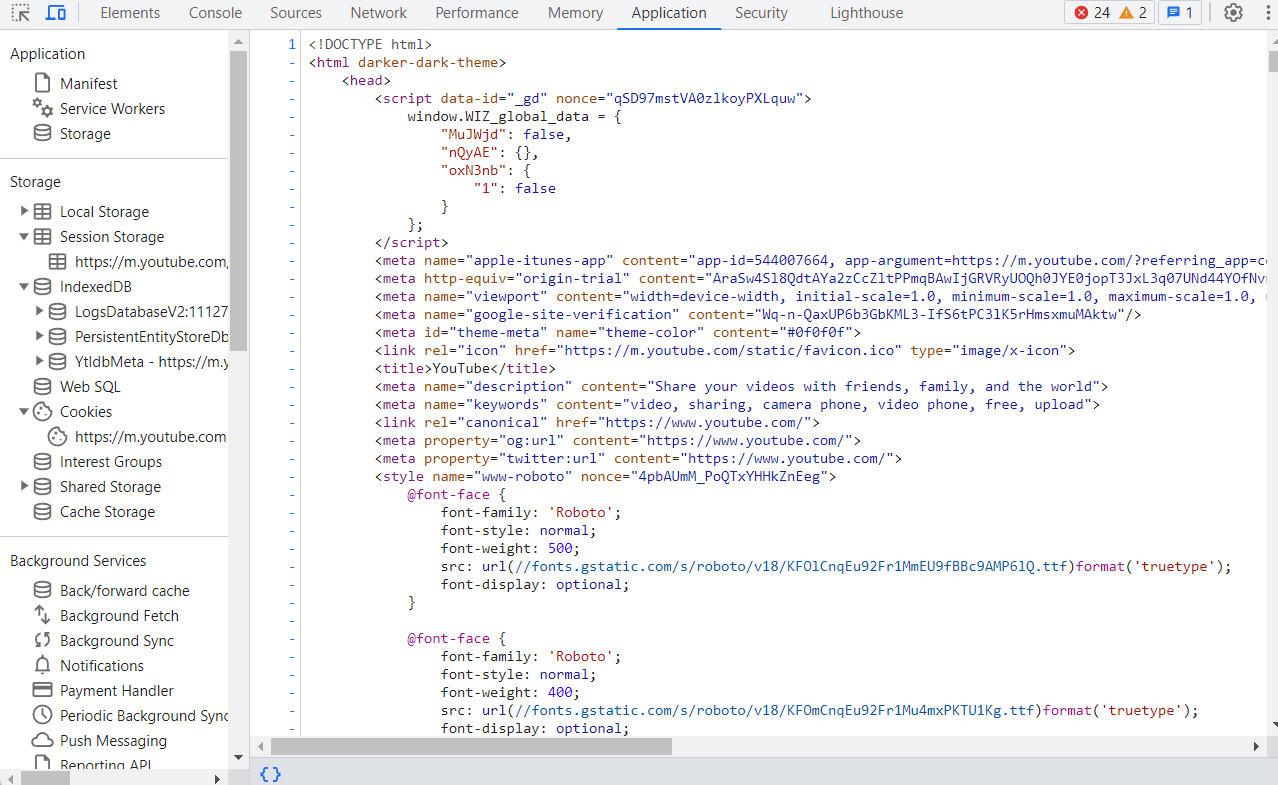
It offers features that allow developers to work with application data such as storage, cache, service workers, and more. Understanding the functionalities of the Application panel is crucial for managing application resources, debugging storage-related issues, and improving the overall performance of web applications. Let’s explore the various features of the Application panel in detail.
- Application Storage:
The Application panel provides information about the different types of storage used by a web application, including Local Storage, Session Storage, Cookies, and IndexedDB. You can inspect and modify the stored data, view the size and usage of each storage type, and manage their contents. This allows you to analyze and debug issues related to data storage and retrieval. - Cache Storage:
The Application panel allows you to work with the Cache Storage API, which is used for storing and retrieving network requests and responses in a cache. You can inspect the cached resources, view their size and expiration details, and manage the cache entries. This feature is useful for debugging issues related to caching, updating cached resources, and improving the performance of your web application. - Service Workers:
The Application panel provides tools for inspecting and managing service workers. You can register and unregister service workers, view their status, and inspect their scripts and associated resources. This allows you to debug service worker-related issues, monitor their performance, and update service worker scripts as needed. - Manifest and PWA Features:
If your web application includes a manifest file and utilizes Progressive Web App (PWA) features, the Application panel allows you to inspect and modify the manifest file. You can view and edit the application’s name, icons, theme colors, and other properties defined in the manifest. This feature is essential for optimizing the PWA experience and ensuring the correct behavior of your web application when installed as a standalone app. - Background Sync and Push Notifications:
The Application panel provides tools for simulating background sync and push notifications. You can trigger background sync events and test the behavior of your application when it’s offline. Additionally, you can simulate push notifications to verify their appearance and interaction within your application. These features are useful for testing and debugging the functionality of background sync and push notifications. - Audits and Performance:
The Application panel includes the Lighthouse audit and performance analysis tool. Lighthouse helps you evaluate your web application’s performance, accessibility, best practices, SEO, and Progressive Web App features. By running Lighthouse audits, you can identify areas for improvement and ensure that your web application meets the latest web development standards. - Clearing Application Data:
The Application panel allows you to clear various types of application data, such as cookies, local storage, cache storage, and service worker registrations. This feature is helpful for resetting the application state and testing different scenarios without the interference of previously stored data. - Application Settings:
The Application panel provides settings that allow you to customize its behavior. You can configure options related to cache, service workers, cookies, and storage usage. These settings enable you to tailor the Application panel to your specific debugging and development needs.
Security Panel:
The Security panel in Chrome Developer Tools provides valuable tools for analyzing and enhancing the security of web applications.
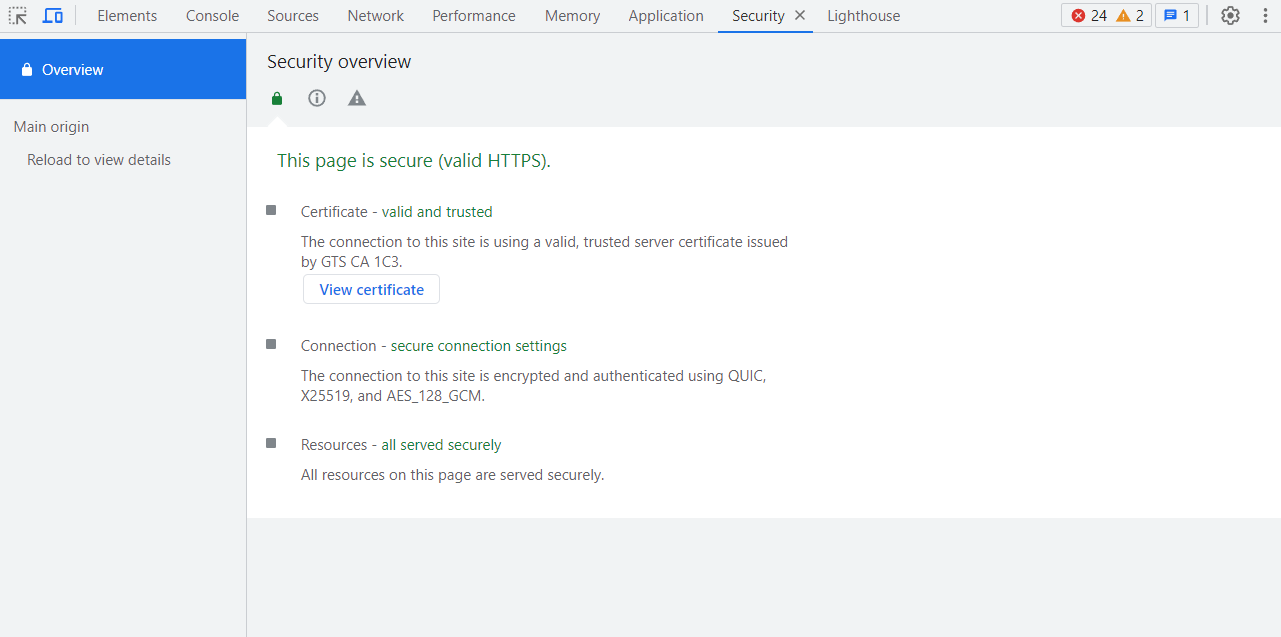
It helps developers identify security vulnerabilities, enforce secure communication, and ensure the privacy and integrity of user data. Understanding the functionalities of the Security panel is crucial for building secure web applications and protecting users from potential threats. Let’s explore the various features of the Security panel in detail.
- Security Overview:
The Security panel provides an overview of the security status of a webpage. It displays information about the security protocols in use, such as HTTPS, and indicates whether the page is secure, partially secure, or insecure. This allows developers to quickly identify potential security issues and take appropriate actions. - Secure Connection:
The Security panel helps ensure secure communication by providing detailed information about the SSL/TLS certificates used by the website. It displays information such as the certificate issuer, expiration date, and certificate chain. This feature allows developers to verify the authenticity of the certificates and detect any potential security risks. - Mixed Content Detection:
The Security panel identifies and warns about mixed content, which refers to a webpage loaded over HTTPS that also includes insecure resources, such as images, scripts, or stylesheets loaded over HTTP. Mixed content can pose security risks and compromise the overall security of the page. The Security panel alerts developers to mixed content issues, allowing them to fix the references and ensure that all resources are loaded securely. - Certificate Transparency:
The Security panel includes a Certificate Transparency feature that provides information about the transparency of the SSL/TLS certificates used by the website. Certificate Transparency helps detect unauthorized or maliciously issued certificates, ensuring the integrity of the certificate ecosystem. By monitoring certificate transparency, developers can identify any anomalous certificates associated with their website. - HSTS (HTTP Strict Transport Security):
The Security panel allows developers to view and manage the HTTP Strict Transport Security policy for a website. HSTS ensures that the website is accessed only over HTTPS, preventing downgrade attacks and enhancing the overall security of the communication. The Security panel provides insights into the HSTS policy and allows developers to enforce or update it as needed. - Subresource Integrity:
The Security panel supports Subresource Integrity (SRI), which is a security feature that allows you to ensure the integrity of externally hosted resources, such as scripts or stylesheets. SRI allows developers to include a cryptographic hash of the resource in the HTML, ensuring that the resource hasn’t been tampered with. The Security panel helps developers verify the integrity of resources using SRI. - Auditing Security Issues:
The Security panel includes auditing capabilities to help developers identify security vulnerabilities in their web applications. It performs checks for various security issues, such as insecure requests, deprecated security features, and missing security headers. The panel provides actionable recommendations to address the identified security risks and improve the overall security posture of the application. - Security Best Practices:
The Security panel offers guidance on security best practices, providing recommendations and suggestions to enhance the security of web applications. It covers topics such as secure coding practices, secure communication, authentication, and authorization. Following these best practices helps developers build robust and secure applications. - Network Security:
The Security panel provides insights into network security, including information about secure connections, encryption algorithms, and secure protocols in use. It helps developers assess the strength of the cryptographic algorithms employed by the website and ensure compliance with industry standards. - Security Events:
The Security panel logs security-related events, such as insecure requests, certificate errors, or security policy violations. It allows developers to review and investigate these events, helping in the identification and mitigation of potential security threats.
Lighthouse:
Lighthouse is an open-source automated tool provided by Chrome Developer Tools that helps developers improve the quality, performance, and accessibility of web pages.
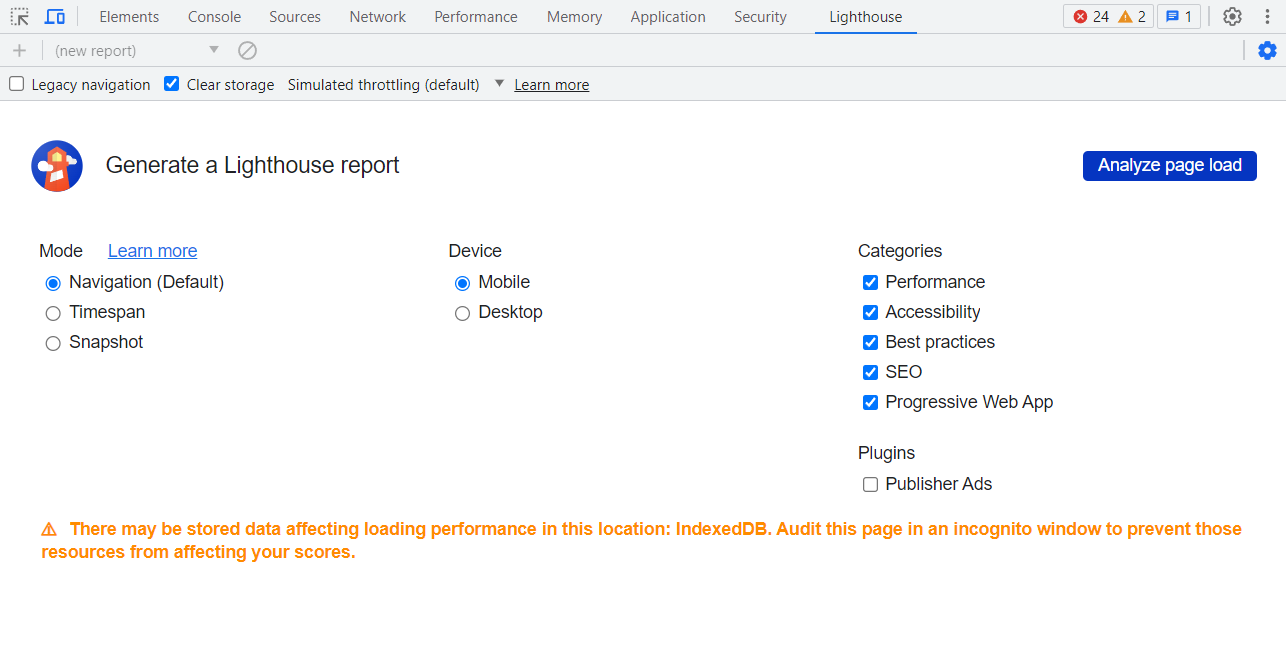
It performs audits on web applications, provides detailed reports, and offers actionable recommendations for optimizing performance, accessibility, best practices, SEO, and Progressive Web App (PWA) features. Lighthouse is an indispensable tool for developers and website owners who strive to provide the best possible user experience. Let’s explore the functionalities of Lighthouse in detail.
- Performance Audits:
Lighthouse performs performance audits to evaluate the speed and efficiency of web pages. It measures various performance metrics, such as First Contentful Paint (FCP), Largest Contentful Paint (LCP), Time to Interactive (TTI), and Total Blocking Time (TBT). By analyzing these metrics, Lighthouse identifies performance bottlenecks and suggests optimizations to improve the overall page loading speed and responsiveness. - Accessibility Audits:
Lighthouse checks web pages for accessibility issues and provides recommendations to ensure that the content is accessible to all users, including those with disabilities. It examines aspects such as proper use of headings, alt attributes on images, color contrast, and keyboard accessibility. By addressing accessibility issues, Lighthouse helps ensure compliance with accessibility standards and promotes inclusivity. - Best Practices Audits:
Lighthouse evaluates web pages against a set of best practices for web development. It checks for adherence to coding standards, security practices, and web platform features. Lighthouse provides recommendations to follow industry best practices, ensuring that the website is built using up-to-date and secure techniques. - SEO Audits:
Lighthouse performs Search Engine Optimization (SEO) audits to assess how well a web page is optimized for search engines. It checks factors such as page titles, meta descriptions, heading structure, and structured data. Lighthouse provides recommendations to improve the website’s visibility and ranking in search engine results. - Progressive Web App (PWA) Audits:
For web applications aiming to provide a native-like experience, Lighthouse evaluates the adherence to Progressive Web App (PWA) principles. It checks if the web app meets the criteria for being installable, responsive, and capable of working offline. Lighthouse provides recommendations to enhance the PWA features, improving user engagement and the overall user experience. - Custom Audits:
Lighthouse allows developers to create custom audits tailored to their specific requirements. This feature enables the evaluation of additional aspects of a web page or application that are not covered by the default audits. Custom audits help address specific performance, accessibility, or SEO concerns unique to the application being developed. - Performance Budgets:
Lighthouse supports the definition and enforcement of performance budgets. Performance budgets define limits on various metrics, such as page size, network requests, or JavaScript execution time. Lighthouse helps monitor and enforce these budgets, allowing developers to ensure that their applications meet the desired performance targets. - Command-Line Interface (CLI):
Lighthouse can be run from the command line, providing the flexibility to incorporate it into automated testing processes or build pipelines. The CLI allows developers to generate Lighthouse reports programmatically, making it easy to integrate Lighthouse into their development workflows. - Lighthouse Reports:
Lighthouse generates detailed reports that summarize the results of the audits performed. The reports highlight areas that need improvement and provide actionable recommendations with supporting information. The reports are presented in an easy-to-understand format, allowing developers to identify and prioritize optimizations effectively. - Integration with Chrome DevTools:
Lighthouse is tightly integrated with Chrome Developer Tools, allowing developers to run audits directly from the Chrome DevTools interface. This integration provides a seamless experience for analyzing and optimizing web pages without the need for additional tools or extensions.
Additional Components and Features:
In addition to the core components discussed earlier, Chrome Developer Tools offers several other useful features and components that aid in the development, debugging, and optimization of web applications. Let’s explore some of these additional components and features in detail.
- Application Panel:
The Application panel, as discussed earlier, provides tools for working with application data such as storage, cache, service workers, and more. It also includes features for auditing and analyzing the performance, accessibility, and Progressive Web App (PWA) features of web applications. - Device Mode:
Device Mode allows developers to emulate various mobile devices and test how their web applications respond to different screen sizes, resolutions, and device orientations. It helps in ensuring that the application is responsive and performs well across a range of devices. - Emulation:
Chrome Developer Tools includes emulation features that enable developers to simulate different network conditions, such as 3G or 4G connections, to assess the performance and loading behavior of their web applications under varying network speeds. This feature is essential for optimizing the performance of applications across different network environments. - Audits:
Chrome Developer Tools provides an extensive set of built-in audits that help identify issues related to performance, accessibility, best practices, SEO, and security. These audits provide detailed reports and actionable recommendations for improving the quality and user experience of web applications. - Coverage:
The Coverage tool allows developers to analyze the CSS and JavaScript code coverage of their web applications. It identifies unused or redundant code, helping optimize the size and performance of the application. - Overrides:
Chrome Developer Tools allows developers to override certain aspects of the webpage behavior, such as geolocation, device orientation, and network conditions. This feature is useful for testing different scenarios and ensuring that the application behaves as expected under different conditions. - Sensors:
The Sensors feature enables developers to simulate geolocation and device orientation in order to test location-based functionalities and responsive design elements in their web applications. - Remote Debugging:
Chrome Developer Tools allows remote debugging of web applications running on remote devices or emulators. This feature enables developers to inspect and debug web applications running on different devices without physically accessing them. - Network Conditions:
Developers can simulate various network conditions, such as latency and throttling, to test how their web applications perform under different network scenarios. This helps identify and address potential performance bottlenecks and optimize the application’s behavior under different network conditions. - Source Maps:
Source Maps allow developers to map the minified or transpiled code of their web applications back to the original source code, making it easier to debug and understand the code during development and in production environments.
These additional components and features of Chrome Developer Tools enhance the debugging, testing, and optimization capabilities for web developers.
Now, as we’ve come to the end of this article, so it’s time to conclude it.
Conclusion:
In conclusion, Chrome Developer Tools is an essential resource for web developers and aspiring developers alike. Its wide range of components and features provide valuable insights and capabilities for debugging, analyzing, and optimizing web applications. Throughout this article, we have explored the various components of Chrome Developer Tools, including the Elements Panel, Console, Sources Panel, Network Panel, Performance Panel, Memory Panel, Application Panel, Security Panel, Lighthouse, and additional features.
To make the most of Chrome Developer Tools, here are some additional suggestions:
- Familiarize yourself with the keyboard shortcuts and productivity features within Chrome Developer Tools to speed up your workflow.
- Keep up with the latest updates and features of Chrome Developer Tools to stay ahead of new debugging and optimization capabilities.
- Experiment with different scenarios and test your web applications under various network conditions and device emulations to ensure cross-compatibility and optimal performance.
- Regularly perform audits using Lighthouse to identify areas for improvement and stay up-to-date with the latest best practices in web development.
- Collaborate with peers and engage in online communities to learn from their experiences, share insights, and discover new tips and tricks for using Chrome Developer Tools effectively.
By incorporating these suggestions into your development process and utilizing the powerful features of Chrome Developer Tools, you can significantly enhance your ability to build high-quality, performant, and secure web applications.
Happy debugging!