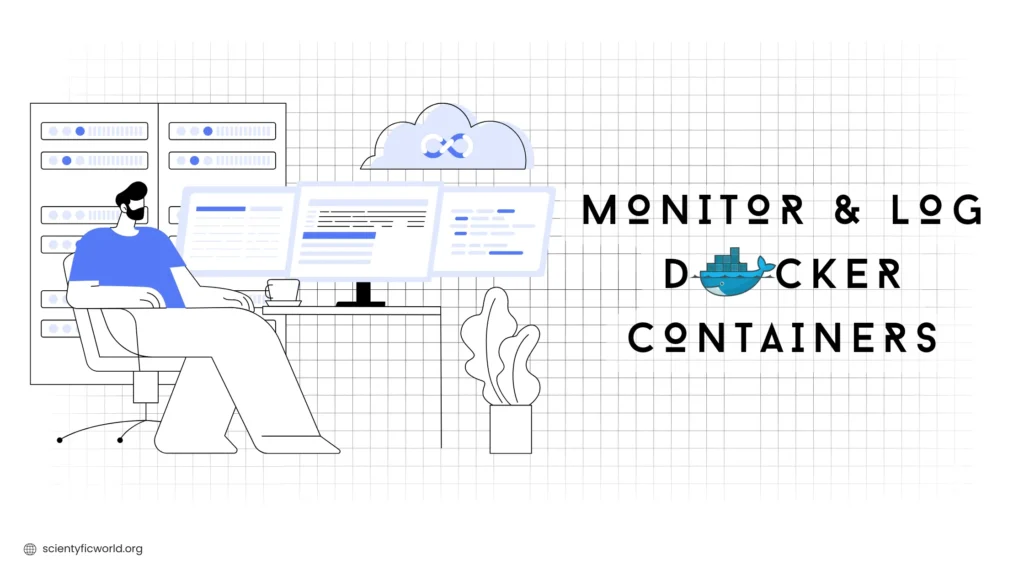
When a container is slow, restarts or runs out of memory, you want answers in seconds: which container, since when, and what else changed. This guide builds a small monitoring stack that gives you exactly that: cAdvisor measures every container, Prometheus stores the numbers and fires alerts, Loki stores logs, Grafana Alloy ships the logs, and Grafana shows it all in one place. The whole thing is one Compose file plus four small config files.
Updated October 2026: I rewrote this 2024 post. The original had several steps that fail in practice: it told Grafana to use http://localhost:9090 for Prometheus and Prometheus to scrape localhost:8080 for cAdvisor, but inside a container localhost is the container itself, so neither connection works. It also installed the Loki Docker logging driver (which Grafana’s documentation now steers people away from in favour of Alloy), repeated the cAdvisor section twice, used an obsolete version: line and “scaled” Prometheus to two replicas, which does not give you high availability. This version fixes all of that, and I ran every config file through the matching tool’s own validator.
What Each Piece Does
| Component | Job | Talks to |
|---|---|---|
| cAdvisor | Measures CPU, memory, network and disk for each container on the host | Docker and the kernel; scraped by Prometheus |
| Prometheus | Scrapes and stores metrics; evaluates alert rules | cAdvisor (pull) |
| Loki | Stores and indexes logs | Receives logs from Alloy |
| Grafana Alloy | Collects container logs from Docker and forwards them | Docker socket, then Loki |
| Grafana | Dashboards, exploration and alert views | Prometheus and Loki as data sources |
Everything runs on one Docker Compose network, so containers reach each other by service name (prometheus, loki, cadvisor). That is the key to the localhost mistake above: use service names between containers, and localhost only for things on the same machine.
Prerequisites
- A Linux host with Docker Engine and the Compose plugin. cAdvisor reads container data from the host’s cgroups and Docker directories, so this stack is designed for Linux servers. On Docker Desktop (Mac or Windows) containers run inside a VM, and the cAdvisor documentation does not cover that case, so expect gaps; use a Linux VM or server for real monitoring.
- About 1 GB of free memory for the monitoring containers themselves, and disk for metrics and logs. The stack below keeps 15 days of metrics and 7 days of logs.
- Basic comfort with YAML. Create a project folder, for example
monitoring/, and put every file below in it.
Step 1: Prometheus Configuration
global:
  scrape_interval: 15s
  evaluation_interval: 15s

rule_files:
  - /etc/prometheus/alerts.yml

scrape_configs:
  - job_name: prometheus
    static_configs:
      - targets: ["localhost:9090"]

  - job_name: cadvisor
    static_configs:
- targets: ["cadvisor:8080"]cadvisor:8080uses the Compose service name. Prometheus pulls metrics from each target every 15 seconds.- The
prometheusjob lets Prometheus monitor itself (inside its own container,localhost:9090is correct). rule_filespoints to the alert rules in the next step.
Step 2: Alert Rules You Can Test
Dashboards are for looking; alerts are for the moments you are not looking. These three rules cover the common container problems:
groups:
  - name: containers
    rules:
      - alert: ContainerHighMemory
        expr: |
          container_memory_working_set_bytes{name!=""}
            / (container_spec_memory_limit_bytes{name!=""} > 0) > 0.90
        for: 5m
        labels:
          severity: warning
        annotations:
          summary: "{{ $labels.name }} is using over 90% of its memory limit"

      - alert: ContainerHighCpu
        expr: sum by (name) (rate(container_cpu_usage_seconds_total{name!=""}[5m])) > 0.9
        for: 10m
        labels:
          severity: warning
        annotations:
          summary: "{{ $labels.name }} has used close to a full CPU core for 10 minutes"

      - alert: ContainerGone
        expr: time() - container_last_seen{name!=""} > 120
        for: 1m
        labels:
          severity: critical
        annotations:
summary: "{{ $labels.name }} has not been seen for more than 2 minutes"- ContainerHighMemory compares memory use to the container’s configured limit. The
> 0part skips containers with no limit, which cAdvisor reports as 0 and would otherwise cause a divide-by-zero. - ContainerHighCpu fires when a container averages close to a full core for ten minutes.
- ContainerGone fires when cAdvisor has not seen a container for two minutes. Be aware that it also fires for containers you stop on purpose, and that cAdvisor forgets a container a short while after it disappears, so treat it as a hint and not a complete “is it running” check.
- The
for:clause means the condition must hold for that long before the alert fires, which avoids alerting on brief spikes. Prometheus’ own alerting practices guide recommends alerting on symptoms that need a human, not on every metric.
Prometheus can unit-test alert rules. This test feeds in made-up series and checks that only the container above 90% of its limit alerts, while a container with plenty of headroom and one with no limit do not (see the unit testing docs):
rule_files:
  - alerts.yml
evaluation_interval: 1m
tests:
  - interval: 1m
    input_series:
      - series: 'container_memory_working_set_bytes{name="web"}'
        values: "950000000+0x10"
      - series: 'container_spec_memory_limit_bytes{name="web"}'
        values: "1000000000+0x10"
      - series: 'container_memory_working_set_bytes{name="db"}'
        values: "100000000+0x10"
      - series: 'container_spec_memory_limit_bytes{name="db"}'
        values: "1000000000+0x10"
      - series: 'container_memory_working_set_bytes{name="nolimit"}'
        values: "900000000+0x10"
      - series: 'container_spec_memory_limit_bytes{name="nolimit"}'
        values: "0+0x10"
    alert_rule_test:
      - eval_time: 8m
        alertname: ContainerHighMemory
        exp_alerts:
          - exp_labels:
              severity: warning
              name: web
            exp_annotations:
              summary: "web is using over 90% of its memory limit"
promtool check rules alerts.yml
promtool test rules alerts_test.yml
# SUCCESSI ran both commands with Prometheus’ promtool and they pass. Putting a test like this in your repository means that a future edit to the rule is checked before it can silently stop alerting. Note that these alerts only appear in Prometheus’ Alerts page until you connect an Alertmanager (or use Grafana’s own alerting, below) to send notifications.
Step 3: Loki and Alloy for Logs
Metrics tell you that something is wrong; logs tell you why. Loki stores them:
auth_enabled: false

server:
  http_listen_port: 3100

common:
  instance_addr: 127.0.0.1
  path_prefix: /loki
  storage:
    filesystem:
      chunks_directory: /loki/chunks
      rules_directory: /loki/rules
  replication_factor: 1
  ring:
    kvstore:
      store: inmemory

schema_config:
  configs:
    - from: 2024-01-01
      store: tsdb
      object_store: filesystem
      schema: v13
      index:
        prefix: index_
        period: 24h

limits_config:
  retention_period: 168h

compactor:
  working_directory: /loki/compactor
  retention_enabled: true
  delete_request_store: filesystem
This is a single-process setup with data on local disk and 7-day retention (the compactor deletes older logs). It is suitable for one host; larger setups use object storage. Loki’s own -verify-config check accepts this file.
To collect logs, the original post installed the Loki Docker logging driver and edited /etc/docker/daemon.json, which needs a daemon restart. Grafana’s Loki driver documentation describes the driver as not carrying the same support commitment as Grafana Alloy and recommends Alloy’s Docker components to avoid known problems such as daemon deadlocks. Alloy reads logs through the Docker API instead, with no change to the daemon:
discovery.docker "containers" {
	host = "unix:///var/run/docker.sock"
}

discovery.relabel "containers" {
	targets = discovery.docker.containers.targets

	rule {
		source_labels = ["__meta_docker_container_name"]
		regex         = "/(.*)"
		target_label  = "container"
	}
}

loki.source.docker "containers" {
	host       = "unix:///var/run/docker.sock"
	targets    = discovery.relabel.containers.output
	forward_to = [loki.write.local.receiver]
}

loki.write "local" {
	endpoint {
		url = "http://loki:3100/loki/api/v1/push"
	}
}
The first block discovers running containers, the second turns Docker’s container name (which starts with a slash) into a clean container label, the third reads their logs (see the loki.source.docker docs) and the last sends them to Loki. I validated this file with alloy validate.
A security note: mounting /var/run/docker.sock into a container gives that container the ability to control Docker, which is effectively root on the host. It is mounted read-only here, but a read-only socket can still be used to read sensitive information. Run only the official image, pin its version, and do not expose Alloy’s port.
Step 4: Grafana Provisioning
Instead of clicking through menus to add data sources, define them in code with Grafana’s provisioning so a rebuilt container comes back configured. Save this as provisioning/datasources/datasources.yml:
apiVersion: 1

datasources:
  - name: Prometheus
    uid: prometheus
    type: prometheus
    access: proxy
    url: http://prometheus:9090
    isDefault: true

  - name: Loki
    uid: loki
    type: loki
    access: proxy
    url: http://loki:3100
Note the URLs: http://prometheus:9090 and http://loki:3100, using service names. This single fix removes the most common “data source connected but no data” problem from the older version of this tutorial.
Step 5: The Compose File
services:
  prometheus:
    image: prom/prometheus:v3.15.0
    command:
      - --config.file=/etc/prometheus/prometheus.yml
      - --storage.tsdb.retention.time=15d
    volumes:
      - ./prometheus.yml:/etc/prometheus/prometheus.yml:ro
      - ./alerts.yml:/etc/prometheus/alerts.yml:ro
      - prometheus_data:/prometheus
    ports:
      - "127.0.0.1:9090:9090"
    restart: unless-stopped

  cadvisor:
    image: ghcr.io/google/cadvisor:v0.60.6
    volumes:
      - /:/rootfs:ro
      - /var/run:/var/run:rw
      - /sys:/sys:ro
      - /var/lib/docker/:/var/lib/docker:ro
    restart: unless-stopped
    # no published port: Prometheus reaches it as cadvisor:8080 on the Compose network

  loki:
    image: grafana/loki:3.7.8
    command: -config.file=/etc/loki/config.yaml
    volumes:
      - ./loki-config.yaml:/etc/loki/config.yaml:ro
      - loki_data:/loki
    restart: unless-stopped

  alloy:
    image: grafana/alloy:v1.20.1
    command:
      - run
      - --server.http.listen-addr=0.0.0.0:12345
      - --storage.path=/var/lib/alloy/data
      - /etc/alloy/config.alloy
    volumes:
      - ./config.alloy:/etc/alloy/config.alloy:ro
      - /var/run/docker.sock:/var/run/docker.sock:ro
    depends_on:
      - loki
    restart: unless-stopped

  grafana:
    image: grafana/grafana:13.2.3
    environment:
      GF_SECURITY_ADMIN_PASSWORD__FILE: /run/secrets/grafana_admin_password
    secrets:
      - grafana_admin_password
    volumes:
      - ./provisioning:/etc/grafana/provisioning:ro
      - grafana_data:/var/lib/grafana
    ports:
      - "127.0.0.1:3000:3000"
    depends_on:
      - prometheus
      - loki
    restart: unless-stopped

secrets:
  grafana_admin_password:
    file: ./grafana_admin_password.txt

volumes:
  prometheus_data:
  loki_data:
grafana_data:- Only Prometheus and Grafana publish ports, and only on
127.0.0.1. cAdvisor, Loki and Alloy have no published ports, because the other containers reach them over the Compose network. Metrics and logs can contain sensitive information, so do not expose these services to the internet; reach Grafana through an SSH tunnel or a reverse proxy with HTTPS and authentication (see our guide to Docker ports). - The Grafana admin password comes from a secret file via the
__FILEsuffix, not from an environment variable in the Compose file. Create it before starting:openssl rand -base64 24 > grafana_admin_password.txt, keep it out of version control, and read it when you first log in asadmin. - Versions are pinned (I confirmed each tag exists on its registry in October 2026). Avoid
latestfor monitoring; an unexpected upgrade should not change your alerts. Update the tags deliberately and read the release notes. - Named volumes keep metrics, logs and Grafana data across container re-creation.
- cAdvisor’s mounts (
/,/var/run,/sysand/var/lib/docker) follow the example in the cAdvisor running guide. Its image is hosted atghcr.io/google/cadvisor. Its docs mention extra flags (such as--privilegedand--pid=host) only for process-level metrics, and--userns=hostif your daemon uses user namespaces; this stack does not need them for container metrics. - There is no
version:line, and nocontainer_name, so you can run several projects on one host without name clashes.
openssl rand -base64 24 > grafana_admin_password.txt
docker compose up -d
docker compose ps
What I tested and what I did not: I validated each config with its own tool (promtool for Prometheus and the alert rules and their unit test, loki -verify-config, alloy validate) and checked that the Compose file parses and that all image tags exist. I could not run Docker on the machine where I wrote this post, so I did not start the stack; the first run on your Linux host is the real test. If something is off, docker compose logs SERVICE is the first place to look.
Step 6: Check That It Works
- Open
http://localhost:9090/targetson the host. Thecadvisorandprometheustargets should show UP. If cadvisor is down, check the logs and the service name inprometheus.yml. - In the Prometheus query box, run
container_memory_working_set_bytes. You should get one series per container. - Open
http://localhost:3000and sign in asadmin. Under Connections, check that both data sources exist and use Save & test to confirm they connect. - Open Explore, choose Loki and run
{container="prometheus"}. You should see that container’s log lines.
Step 7: Build Useful Dashboards
You can build panels yourself or import ready-made ones: in Grafana, go to Dashboards, then New, then Import dashboard, and paste a dashboard URL or ID from Grafana’s dashboard catalogue (see the import documentation). Search the catalogue for “cAdvisor” or “Docker” and check a dashboard’s last update date and reviews before you rely on it. If you build your own, these queries (all of which I syntax-checked with promtool) cover the essentials:
| Panel | Query |
|---|---|
| CPU cores used per container | sum by (name) (rate(container_cpu_usage_seconds_total{name!=""}[5m])) |
| Memory in use | container_memory_working_set_bytes{name!=""} |
| Memory as a share of the limit | container_memory_working_set_bytes{name!=""} / (container_spec_memory_limit_bytes{name!=""} > 0) |
| Network receive rate | sum by (name) (rate(container_network_receive_bytes_total{name!=""}[5m])) |
| Network transmit rate | sum by (name) (rate(container_network_transmit_bytes_total{name!=""}[5m])) |
| Errors in logs (Loki) | {container="web"} |= "error" |
The name!="" filter hides the host-level series that cAdvisor also reports. Use a Grafana variable on the name label to get a dropdown of containers, and put the log panel next to the CPU and memory panels so a spike and its log lines appear together.
Alerting and Notifications
Prometheus evaluates the rules above, but sending an email or chat message requires an Alertmanager or Grafana’s built-in alerting. Grafana’s alerting documentation covers contact points (email, Slack, webhooks) and notification policies. A sound approach: start with a few alerts that always mean “a human should look” (the three here), send them to one channel, and tune thresholds for a couple of weeks before adding more. Too many alerts teach people to ignore all of them.
Running It in Production
- Monitor the monitor. Alert if Prometheus targets go down (the built-in
upmetric is 0), and make sure the disk holding metrics and logs cannot fill up. Retention settings (15 days of metrics, 7 days of logs here) bound the growth. - Back up Grafana’s volume (or keep dashboards as JSON in version control), because dashboards you build in the UI live in its database.
- Do not “scale” Prometheus by running two copies. Two instances with separate storage each hold their own data; high availability needs a different design (two independent instances scraping the same targets, plus a query layer or remote storage).
- Secure access. Put Grafana behind HTTPS and real authentication, and if you ever expose the Docker daemon remotely, follow Docker’s guide to protecting access rather than opening its port.
- Consider the daemon’s own metrics. Docker Engine can expose Prometheus metrics about the engine itself (see the Docker documentation), a useful addition to cAdvisor’s per-container data.
- Know when to stop self-hosting. For a handful of containers this stack is cheap and educational; if you run many hosts, compare it with a managed service so you are not maintaining monitoring instead of your product.
Conclusion
Docker monitoring comes down to a clear pipeline: cAdvisor measures, Prometheus stores and alerts, Alloy ships logs to Loki, and Grafana shows metrics and logs side by side. The details that decide whether it works are using service names instead of localhost, not publishing ports you do not need, pinning versions, and testing your alert rules. Start with the stack above on a Linux host, confirm the targets are UP, and add alerts one at a time.
Why can’t Grafana connect to Prometheus at localhost:9090?
Inside the Grafana container, localhost means the Grafana container itself, not your host or the Prometheus container. Use the Compose service name instead, for example http://prometheus:9090, as long as both containers are on the same Compose network.
Do I need cAdvisor to monitor Docker containers with Prometheus?
It is the most common way to get per-container CPU, memory, network and disk metrics. Docker Engine can also expose its own metrics, but those describe the engine, not each container’s resource use. Best results come from running cAdvisor on a Linux host.
Should I use the Loki Docker logging driver or Grafana Alloy?
Grafana recommends Alloy. Its documentation says the Docker driver does not carry the same support commitment, and it points to Alloy’s Docker components to avoid issues such as daemon deadlocks. Alloy also needs no change to the Docker daemon configuration.
Is it safe to mount the Docker socket into a monitoring container?
It is a real risk, because access to the socket is effectively root access to the host. Mount it read-only, use only the official pinned image, keep the container off public networks and avoid exposing its ports.
How do I get alert notifications from this stack?
Prometheus evaluates the alert rules, but you need an Alertmanager or Grafana alerting with a contact point such as email or Slack to send notifications. Start with a few alerts that always need human action, and test your rules with promtool test rules.